Thank you for using the timer - this advanced tool can estimate your performance and suggest more practice questions. We have subscribed you to Daily Prep Questions via email.
Customized for You
we will pick new questions that match your level based on your Timer History
Track Your Progress
every week, we’ll send you an estimated GMAT score based on your performance
Practice Pays
we will pick new questions that match your level based on your Timer History
Not interested in getting valuable practice questions and articles delivered to your email? No problem, unsubscribe here.
Thank you for using the timer!
We noticed you are actually not timing your practice. Click the START button first next time you use the timer.
There are many benefits to timing your practice, including:
Join the Easter Egg Scavenger Hunt (April 6 - 20 2025) Here is how it works - there are 14 Easter-themed logos/images scattered around the website. When you see one - click it and you will see a pop-up image similar to the one above.
Hop into Success with our Easter sale on Online GMAT Prep. With GMATWhiz, you get a personalized and actionable advance study planner to help you score 99th %ile in less than 90 days at a price as low as $149. Limited period offer! Act fast!
In this webinar, Senior Verbal Expert- Sunita Singhvi will break down the toughest MSR questions, providing you with a step-by-step roadmap to reduce solving time, boost accuracy and navigate through them effectively to score high on GMAT.
MAT Boldface questions intimidate most test-takers—but what if they're easier than you think? GMAT expert Arun debunks common misconceptions about Boldface questions which are an important component of GMAT Critical Reasoning.
Originally posted by ubertu on 02 Apr 2020, 00:28.
Last edited by Sajjad1994 on 27 Sep 2023, 14:06, edited 5 times in total.
2
Kudos
Add Kudos
65
Bookmarks
Bookmark this Post
Show timer
00:00
Start Timer
Pause Timer
Resume Timer
Show Answer
Hide Answer
Correct Answer
Hide
Show
History
Dropdown 1: 20
Dropdown 2: Aggregate and repost content
Be sure to select an answer first to save it in the Error Log before revealing the correct answer (OA)!
Select the dropdowns below and click "Submit" to add this question to your Error log.
Difficulty:
95%
(hard)
Question Stats:
36%
(03:11)
correct 64%
(02:59)
wrong
based on 836
sessions
History
Date
Time
Result
Not Attempted Yet
The graph shows the percentages of Internet users in different age groups who participated in various online activities in 2007. Publishing web pages, writing blogs, and uploading videos is considered creating primary content, but content created on social networking sites is not considered primary content.
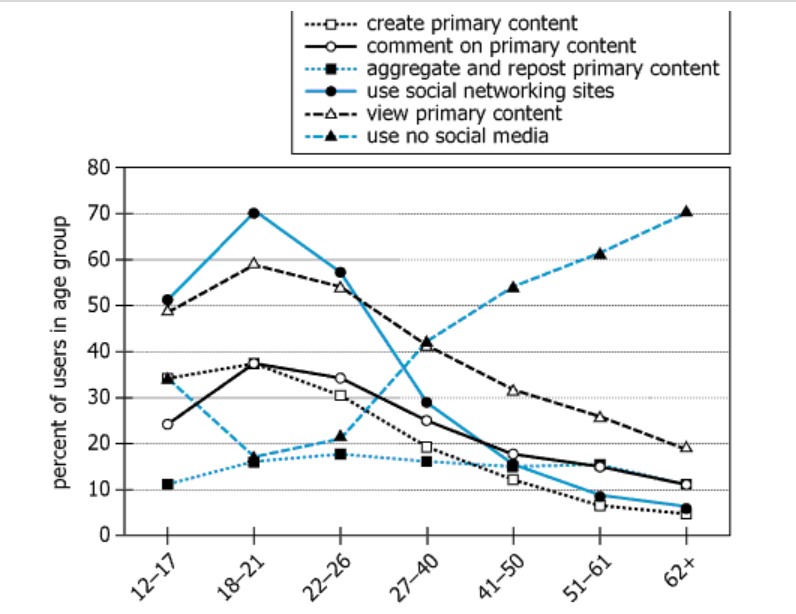
Attachment:
blabla.png [ 124.05 KiB | Viewed 18332 times ]
For each of the following, use the drop-down menu to create the most accurate statement on the basis of the information provided.
1. RO1 - In 2007, of the Internet users 62 years old or older who used one or more forms of social media, approximately percent used social networking sites.
2. RO2 - The graph most clearly indicates that in 2007 less than 20 percent of all Internet users over the age of 11 -
Submit Answer
Start the Timer above, select the dropdowns, and click "Submit" to add this question to your Error log.
Select the dropdowns, and click "Submit" to add this question to your Error log.
Here is a detailed video solution for this interesting question. See how this question can be solved in the test environment using "Owning the Dataset" approach.
Hi Sajjad1994 and KarishmaB, I think we're missing one key point here in Question 1. Could you please help point out if there's a flaw in my understanding?
We are saying that 70% users aged 62+ do not use any form of social media, then we fragment the remaining 30% to find our answer.
However, I see that the split-up of these remaining people who use social media is actually not adding upto 30%. Reading figures from the graph here's what I get:
Create primary content: 5% Comment on primary content: 11% Aggregate and report primary content: 11% Use social networking sites: 6% View primary content: 20%
We can see 5+11+11+6+20=53% and not 30%
And consequently 6/53 ~~ 11% should be our required answer, or in this case the nearest option, option B (8%)
Posted from my mobile device
There will be overlap. For example, many creators will view content too etc. One person could be counted in multiple of these sets and that is why the overall percentage is higher than 30.
Of the Internet users 62 years old or older, approximately 70 percent use no social media. Therefore, approximately 30 percent use some form of social media. Of the users in this age group, approximately 5 to 6 percent use social networking sites. This latter group is a subset of the 30 percent who use some form of social media. Therefore, the percentage of the 30 percent that is also a member of the 5 to 6 percent is 5/30≈16.7% to 6/30=20%. The only available option in this range of values is 20%.
The correct answer is 20.
The graph deals only with Internet users over the age of 11, and the only activity shown in the graph that has less than 20 percent participation in all of the age groups is aggregate and repost content. Each of the other activities has greater than 20 percent participation in several age groups and, because the relative number of people in different age groups is unknown, there is insufficient information to determine the rate of participation for these activities.
The correct answer is aggregate and repost content.
Project IR Butler 2019-20 - Get one IR Question Everyday Question # 183, Date : 02-Apr-2020 This post is a part of Project IR Butler 2019-20. Click here for Details
The graph shows the percentages of Internet users in different age groups who participated in various online activities in 2007. Publishing web pages, writing blogs, and uploading videos is considered creating primary content, but content created on social networking sites is not considered primary content.
Attachment:
blabla.png
For each of the following, use the drop-down menu to create the most accurate statement on the basis of the information provided.
1. RO1 - In 2007, of the Internet users 62 years old or older who used one or more forms of social media, approximately_____________percent used social networking sites.
A. 6 B. 8 C. 20 D. 30
2. RO2 - The graph most clearly indicates that in 2007 less than 20 percent of all Internet users over the age of 11____________.
A. Were 62 years old or older B. Aggregate and repost content C. Create content D. were under 22 years old
1. RO1 - In 2007, of the Internet users 62 years old or older who used one or more forms of social media, approximately_____________percent used social networking sites.
In 2007, The Internet users 62 years old or older who used one or more forms of social media = 20 + 10 + 8 + 5 = 43 In 2007, The Internet users 62 years old or older who used social networking sites = 8 In 2007, of the Internet users 62 years old or older who used one or more forms of social media, approximately 8/43 ~ 20 %_percent used social networking sites.
IMO C
2. RO2 - The graph most clearly indicates that in 2007 less than 20 percent of all Internet users over the age of 11____________.[/b][/color]
A. Were 62 years old or older B. Aggregate and repost content C. Create content D. were under 22 years old
Since the graph of B. Aggregate and repost content never exceeded 20% IMO B
Project IR Butler 2019-20 - Get one IR Question Everyday Question # 183, Date : 02-Apr-2020 This post is a part of Project IR Butler 2019-20. Click here for Details
The graph shows the percentages of Internet users in different age groups who participated in various online activities in 2007. Publishing web pages, writing blogs, and uploading videos is considered creating primary content, but content created on social networking sites is not considered primary content.
Attachment:
blabla.png
For each of the following, use the drop-down menu to create the most accurate statement on the basis of the information provided.
1. RO1 - In 2007, of the Internet users 62 years old or older who used one or more forms of social media, approximately_____________percent used social networking sites.
A. 6 B. 8 C. 20 D. 30
2. RO2 - The graph most clearly indicates that in 2007 less than 20 percent of all Internet users over the age of 11____________.
A. Were 62 years old or older B. Aggregate and repost content C. Create content D. were under 22 years old
Hi KarishmaB! In the first statement, why do we need to divide 6% to 30% (6/30≈20%) to get to the right answer? My understanding is that the blue line (use social networking sites) for the age group of +62 years was the correct answer, representing around 6%... thank you!
The question says: In 2007, of the Internet users 62 years old or older who used one or more forms of social media, approximately_____________percent used social networking sites.
In this age group, we want to find the number of people who use social networking sites as a percentage of total number of people who use one or more forms of social media.
From the graph, we can see that 70% do not use social media. So 30% do use it. From the graph we can also see that 6% people use social networking sites. So if there were 100 people in this age group, 70 would not use social median and 30 would use. Out of those 30, 6 use social networking sites. So percentage of people using social networking sites of the total number of people using social media would be 6/30 * 100 = 20%
Hi Sajjad1994 and KarishmaB, I think we're missing one key point here in Question 1. Could you please help point out if there's a flaw in my understanding?
We are saying that 70% users aged 62+ do not use any form of social media, then we fragment the remaining 30% to find our answer.
However, I see that the split-up of these remaining people who use social media is actually not adding upto 30%. Reading figures from the graph here's what I get:
Create primary content: 5% Comment on primary content: 11% Aggregate and report primary content: 11% Use social networking sites: 6% View primary content: 20%
We can see 5+11+11+6+20=53% and not 30%
And consequently 6/53 ~~ 11% should be our required answer, or in this case the nearest option, option B (8%)
Posted from my mobile device
There will be overlap. For example, many creators will view content too etc. One person could be counted in multiple of these sets and that is why the overall percentage is higher than 30.
Thank you KarishmaB, this opens up a whole new way for me to understand these problems
Note: Many responses in this thread have endorsed the correct answer incorrectly. Please be cautious of misleading approaches.
Question 1 is a tough one where most explanations in thread are wrong. What many have counted as 44% is not actally 44% as there are some overlap among those categories. The union sum of those is 30% which can be calculated this way
People in age group 62+ who use no social media (Filled triangle line) is at 70% i.e 70% of people in that age group use on social media
i.e. 100-70 = 30% use one or more forms of social media. (Point-1)
Now, people who used docial networking sites = 6% or 7% (You need to read it in approximation as there are no exactness in graph) (Point-2)
Now, of these 30 people, 6 used social networking sites therefore their percentage =\( \frac{6}{30}\) = 20% (Point-3)
Question 2 here was a simple one. We need to see the graph which for all age groups stays below 20% horizontal line int he graph here. The line graph of filled rectangle (Aggregate and repost primary content) line stays below 20% for all age groups hence the correct answer
ubertu
The graph shows the percentages of Internet users in different age groups who participated in various online activities in 2007. Publishing web pages, writing blogs, and uploading videos is considered creating primary content, but content created on social networking sites is not considered primary content.
Attachment:
blabla.png
For each of the following, use the drop-down menu to create the most accurate statement on the basis of the information provided.
1. RO1 - In 2007, of the Internet users 62 years old or older who used one or more forms of social media, approximately percent used social networking sites.
2. RO2 - The graph most clearly indicates that in 2007 less than 20 percent of all Internet users over the age of 11 -