Last visit was: 19 Nov 2025, 03:48 It is currently 19 Nov 2025, 03:48
Close
GMAT Club Daily Prep
Thank you for using the timer - this advanced tool can estimate your performance and suggest more practice questions. We have subscribed you to Daily Prep Questions via email.

Customized
for You

we will pick new questions that match your level based on your Timer History

Track
Your Progress

every week, we’ll send you an estimated GMAT score based on your performance

Practice
Pays

we will pick new questions that match your level based on your Timer History
Not interested in getting valuable practice questions and articles delivered to your email? No problem, unsubscribe here.
Close
Request Expert Reply
Confirm Cancel
User avatar
Sajjad1994
User avatar
GRE Forum Moderator
Joined: 02 Nov 2016
Last visit: 18 Nov 2025
Posts: 17,289
Own Kudos:
49,302
 [20]
Given Kudos: 6,179
GPA: 3.62
Products:
Posts: 17,289
Kudos: 49,302
 [20]
Kudos
Add Kudos
20
Bookmarks
Bookmark this Post
Most Helpful Reply
User avatar
Sajjad1994
User avatar
GRE Forum Moderator
Joined: 02 Nov 2016
Last visit: 18 Nov 2025
Posts: 17,289
Own Kudos:
Given Kudos: 6,179
GPA: 3.62
Products:
Posts: 17,289
Kudos: 49,302
Kudos
Add Kudos
Bookmarks
Bookmark this Post
General Discussion
avatar
TarunKumar1234
Joined: 14 Jul 2020
Last visit: 28 Feb 2024
Posts: 1,107
Own Kudos:
1,348
 [1]
Given Kudos: 351
Location: India
Posts: 1,107
Kudos: 1,348
 [1]
Kudos
Add Kudos
1
Bookmarks
Bookmark this Post
User avatar
Sumi1010
Joined: 21 Aug 2018
Last visit: 19 Jan 2025
Posts: 300
Own Kudos:
Given Kudos: 20
Location: India
Posts: 300
Kudos: 696
Kudos
Add Kudos
Bookmarks
Bookmark this Post
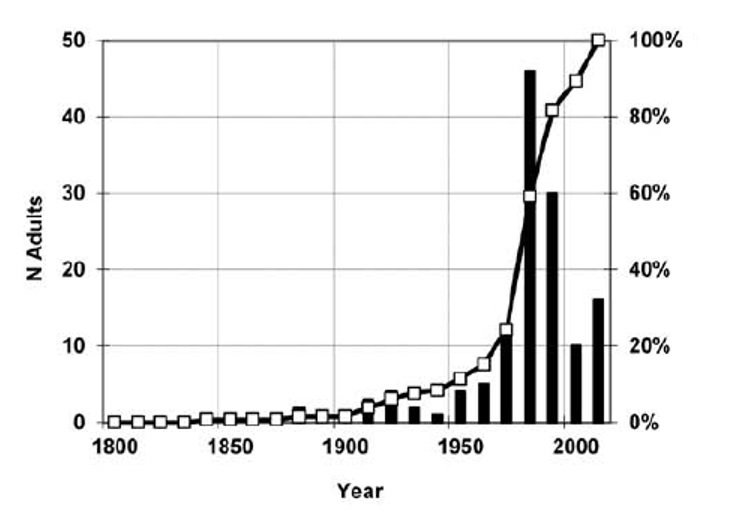
The histogram shows the decade wise collection and rising curve is cumulative collection.

1.1. According to the figure, the total number of current deinopid museum collections is approximately___________.

A. 100
B. 105
C. 120
D. 135
E. 150

This has to be sum of all the decade wise values from 1800 to 2019.
0+0+0+0+1+0+0+0+1+0+0+2+3+2+1+4+5+12+46+30+10+16 = 133 (closer to 135)

Hence D

1.2. According to the figure, in the 1980s the number of global deinopid museum collections grew by approximately____________percent.

A. 30
B. 45
C. 50
D. 55
E. 60

The number of global deinopid museum collections in until 1980 = 0+0+0+0+1+0+0+0+1+0+0+2+3+2+1+4+5= 19
The number of global deinopid museum collections in until 1989 = 0+0+0+0+1+0+0+0+1+0+0+2+3+2+1+4+5+12 = 31
Growth in percentage
(31-19)/19 x 100 = 63.15 % closer to 60%

E
avatar
Deepakjhamb
Joined: 29 Mar 2020
Last visit: 15 Sep 2022
Posts: 218
Own Kudos:
Given Kudos: 14
Location: India
Concentration: General Management, Leadership
GPA: 3.96
WE:Business Development (Telecommunications)
Posts: 218
Kudos: 135
Kudos
Add Kudos
Bookmarks
Bookmark this Post
1.1. According to the figure, the total number of current deinopid museum collections is approximately___________.

A. 100
B. 105
C. 120
D. 135
E. 150


answer is e)150 , if we add all the adult spiders it becomes (seeing from left side of graph ) it becomes
(from 1840 to 2010 )


1.2. According to the figure, in the 1980s the number of global deinopid museum collections grew by approximately____________percent.

A. 30
B. 45
C. 50
D. 55
E. 60

as seen from graph on right hand side % increase in 1980 = 60% so answer is e) 60
User avatar
rocky620
User avatar
Retired Moderator
Joined: 10 Nov 2018
Last visit: 11 May 2023
Posts: 501
Own Kudos:
Given Kudos: 229
Location: India
Concentration: General Management, Strategy
GMAT 1: 590 Q49 V22
WE:Other (Retail: E-commerce)
GMAT 1: 590 Q49 V22
Posts: 501
Kudos: 607
Kudos
Add Kudos
Bookmarks
Bookmark this Post
1.1. According to the figure, the total number of current deinopid museum collections is approximately___________.

Total Growth in:
2019 = 50
2010 = 44
2000 = 40
1990 = 30
Total = 164. No need to calculate further. We can see that the largest no is 150

IMO Option E

1.2. According to the figure, in the 1980s the number of global deinopid museum collections grew by approximately____________percent.

1980 is fifth bar from right. the growth is between 20-40%

IMO Option A
User avatar
Sajjad1994
User avatar
GRE Forum Moderator
Joined: 02 Nov 2016
Last visit: 18 Nov 2025
Posts: 17,289
Own Kudos:
Given Kudos: 6,179
GPA: 3.62
Products:
Posts: 17,289
Kudos: 49,302
Kudos
Add Kudos
Bookmarks
Bookmark this Post
Question #1.1 is medium level difficult and comparatively easy to identify but question #1.2 is hard to identify but once identified it become very easy. Good job Sumi1010. OA is updated Its D for both of the questions. Points table will be updated soon.

Good Luck for today’s questions
User avatar
Jks3000
Joined: 28 Mar 2018
Last visit: 12 Nov 2025
Posts: 173
Own Kudos:
Given Kudos: 63
Location: India
Concentration: Strategy, Technology
GMAT 1: 700 Q49 V36
GMAT 2: 730 Q50 V39
Products:
GMAT 2: 730 Q50 V39
Posts: 173
Kudos: 77
Kudos
Add Kudos
Bookmarks
Bookmark this Post
Source: GMAT Club Tests ????

Where in Tests ?? I have subscribed to GC Tests but there are only Quants and Verbal CATs and Quizzes !!!!

Sajjad1994 Where is IR in GC Tests ??
User avatar
Sajjad1994
User avatar
GRE Forum Moderator
Joined: 02 Nov 2016
Last visit: 18 Nov 2025
Posts: 17,289
Own Kudos:
Given Kudos: 6,179
GPA: 3.62
Products:
Posts: 17,289
Kudos: 49,302
Kudos
Add Kudos
Bookmarks
Bookmark this Post
Jks3000
Source: GMAT Club Tests ????

Where in Tests ?? I have subscribed to GC Tests but there are only Quants and Verbal CATs and Quizzes !!!!

Sajjad1994 Where is IR in GC Tests ??

These questions are a copy righted property of GMAT Club, very are aiming to upgrade the GC tests and will include IR section in future.
User avatar
Jks3000
Joined: 28 Mar 2018
Last visit: 12 Nov 2025
Posts: 173
Own Kudos:
Given Kudos: 63
Location: India
Concentration: Strategy, Technology
GMAT 1: 700 Q49 V36
GMAT 2: 730 Q50 V39
Products:
GMAT 2: 730 Q50 V39
Posts: 173
Kudos: 77
Kudos
Add Kudos
Bookmarks
Bookmark this Post
Sajjad1994
Jks3000
Source: GMAT Club Tests ????

Where in Tests ?? I have subscribed to GC Tests but there are only Quants and Verbal CATs and Quizzes !!!!

Sajjad1994 Where is IR in GC Tests ??

These questions are a copy righted property of GMAT Club, very are aiming to upgrade the GC tests and will include IR section in future.


Okkk... Thankyou Sajjad1994 for these butler projects and detailed explanations. It really helps a lot!!
User avatar
Bambi2021
Joined: 13 Mar 2021
Last visit: 23 Dec 2021
Posts: 319
Own Kudos:
136
 [1]
Given Kudos: 226
Posts: 319
Kudos: 136
 [1]
1
Kudos
Add Kudos
Bookmarks
Bookmark this Post
Sajjad1994

I would like to question the diagram, or at least the correct answer to the second question. Why is the single year 2019 represented by one entire bar in your explanation? For 2019 you have written 16. But doesnt the rightmost bar represent the latest decade from 2010-2019?

2010-2019: 16
2000-2009: 10
1990-1999: 30
1980-1989: 47

So in the 1980's the collection grew by more than 100 %.
User avatar
Sajjad1994
User avatar
GRE Forum Moderator
Joined: 02 Nov 2016
Last visit: 18 Nov 2025
Posts: 17,289
Own Kudos:
Given Kudos: 6,179
GPA: 3.62
Products:
Posts: 17,289
Kudos: 49,302
Kudos
Add Kudos
Bookmarks
Bookmark this Post
Bambi2021
Sajjad1994

I would like to question the diagram, or at least the correct answer to the second question. Why is the single year 2019 represented by one entire bar in your explanation? For 2019 you have written 16. But doesnt the rightmost bar represent the latest decade from 2010-2019?

2010-2019: 16
2000-2009: 10
1990-1999: 30
1980-1989: 47

So in the 1980's the collection grew by more than 100 %.

Read the question statement above the diagram, I cannot write year 2020 as the question statement has said that the data is from year 1800 to year 2019.
avatar
NikLexx
Joined: 18 May 2021
Last visit: 18 May 2021
Posts: 4
Own Kudos:
Posts: 4
Kudos: 1
Kudos
Add Kudos
Bookmarks
Bookmark this Post
Quite an interesting assignment. I had to stretch my brain :dazed
User avatar
Bambi2021
Joined: 13 Mar 2021
Last visit: 23 Dec 2021
Posts: 319
Own Kudos:
Given Kudos: 226
Posts: 319
Kudos: 136
Kudos
Add Kudos
Bookmarks
Bookmark this Post
Sajjad1994

Read the question statement above the diagram, I cannot write year 2020 as the question statement has said that the data is from year 1800 to year 2019.
Yes, but the bars represents decades and the 1980's is the fourth decade from the right. This number is 46, not 12. During the 1980's the collection grew by 46.

2019-2010 - the rightmost bar
2009-2000 - the second bar from the right
1999-1990 - the third bar from the right
1989-1980 - the fourth bar from the right
User avatar
RahulJain293
Joined: 24 Apr 2022
Last visit: 25 May 2025
Posts: 167
Own Kudos:
Given Kudos: 96
Location: India
Concentration: General Management, Nonprofit
GMAT Focus 1: 585 Q81 V80 DI76
Posts: 167
Kudos: 100
Kudos
Add Kudos
Bookmarks
Bookmark this Post
Sajjad1994 I had a doubt.. How do I interpret the table?
There is no mention of what does the black bar or the points depict.. Also the 'N Adults' is something that is not explained in the question..

When I need to add something for ex, in Q1 - I am confused if I am to use the black bar as reference or the square points as reference.

Please help advise!
User avatar
Sajjad1994
User avatar
GRE Forum Moderator
Joined: 02 Nov 2016
Last visit: 18 Nov 2025
Posts: 17,289
Own Kudos:
Given Kudos: 6,179
GPA: 3.62
Products:
Posts: 17,289
Kudos: 49,302
Kudos
Add Kudos
Bookmarks
Bookmark this Post
RahulJain293
Sajjad1994 I had a doubt.. How do I interpret the table?
There is no mention of what does the black bar or the points depict.. Also the 'N Adults' is something that is not explained in the question..

When I need to add something for ex, in Q1 - I am confused if I am to use the black bar as reference or the square points as reference.

Please help advise!

Growth is depicted by square points and bars are just following them to show the overall growth trend. You don't need to know detail about the N' Adult to answer the question. Some data is always provided to trick or confuse the test takers. Furthermore read my explanation here in the link below.

https://gmatclub.com/forum/the-figure-b ... l#p2697968
User avatar
bumpbot
User avatar
Non-Human User
Joined: 09 Sep 2013
Last visit: 04 Jan 2021
Posts: 38,582
Own Kudos:
Posts: 38,582
Kudos: 1,079
Kudos
Add Kudos
Bookmarks
Bookmark this Post
Hello from the GMAT Club BumpBot!

Thanks to another GMAT Club member, I have just discovered this valuable topic, yet it had no discussion for over a year. I am now bumping it up - doing my job. I think you may find it valuable (esp those replies with Kudos).

Want to see all other topics I dig out? Follow me (click follow button on profile). You will receive a summary of all topics I bump in your profile area as well as via email.
Moderators:
Math Expert
105379 posts
496 posts