Events & Promotions
|
|

GMAT Club Daily Prep
Thank you for using the timer - this advanced tool can estimate your performance and suggest more practice questions. We have subscribed you to Daily Prep Questions via email.
Customized
for You
Track
Your Progress
Practice
Pays
Not interested in getting valuable practice questions and articles delivered to your email? No problem, unsubscribe here.
- Nov 18
11:00 AM PST
-12:00 PM PST
Join us in a live GMAT practice session and solve 30 challenging GMAT questions with other test takers in timed conditions, covering GMAT Quant, Data Sufficiency, Data Insights, Reading Comprehension, and Critical Reasoning questions. - Nov 22
11:00 AM IST
-01:00 PM IST
Do RC/MSR passages scare you? e-GMAT is conducting a masterclass to help you learn – Learn effective reading strategies Tackle difficult RC & MSR with confidence Excel in timed test environment - Nov 23
11:00 AM IST
-01:00 PM IST
Attend this free GMAT Algebra Webinar and learn how to master the most challenging Inequalities and Absolute Value problems with ease. - Nov 25
10:00 AM EST
-11:00 AM EST
Prefer video-based learning? The Target Test Prep OnDemand course is a one-of-a-kind video masterclass featuring 400 hours of lecture-style teaching by Scott Woodbury-Stewart, founder of Target Test Prep and one of the most accomplished GMAT instructors.
Originally posted by Sajjad1994 on 04 May 2020, 00:33.
Last edited by BottomJee on 01 Dec 2023, 12:19, edited 6 times in total.
Last edited by BottomJee on 01 Dec 2023, 12:19, edited 6 times in total.
Moved to new forum
Kudos
Bookmarks
Dropdown 1: 2004 to 2005
Dropdown 2: Greater than $70 Millions
Be sure to select an answer first to save it in the Error Log before revealing the correct answer (OA)!
Difficulty:
 5%
(low)
Question Stats:
92% (01:49) correct 8%
(02:04)
wrong
  based on 469
sessions
History
Date
Time
Result
Not Attempted Yet
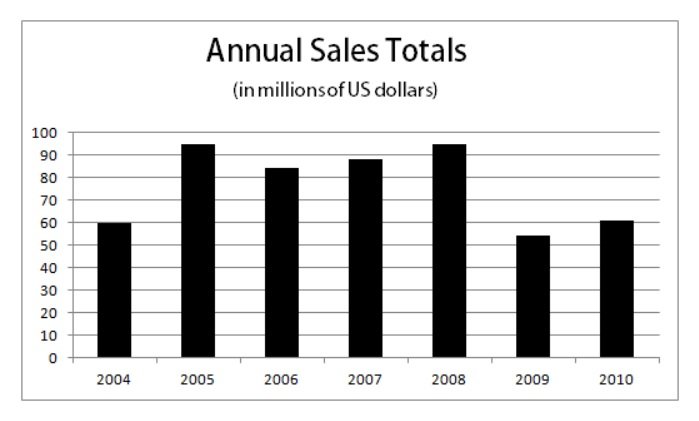
The graph below shows the sales figures for a manufacturing company during the years 2004-2010.
 Based on the graph, please answer the questions that follow:
1. Which year saw the greatest percent change in sales from the previous year?
2. The average sales volume for the period 2004 to 2010 was:

1111.jpg [ 49.16 KiB | Viewed 7073 times ]
1. Which year saw the greatest percent change in sales from the previous year?
2. The average sales volume for the period 2004 to 2010 was:
Attachment:
1111.jpg [ 49.16 KiB | Viewed 7073 times ]
ShowHide Answer
Official Answer
Dropdown 1: 2004 to 2005
Dropdown 2: Greater than $70 Millions
Kudos
Bookmarks
1) A,The percentage changes for the options are:
2004-05->95-60/60=58%
2006-07->89-84/84=5.9%
2007-08->94-89/89=5.6%
So answer is A,since 2004-05 saw the biggest change
2)Avg is:
60+95+84+89+94+54+60/7=76.57> 70 million$ so answer is A
3)A,2006 has median value of 84
Posted from my mobile device
2004-05->95-60/60=58%
2006-07->89-84/84=5.9%
2007-08->94-89/89=5.6%
So answer is A,since 2004-05 saw the biggest change
2)Avg is:
60+95+84+89+94+54+60/7=76.57> 70 million$ so answer is A
3)A,2006 has median value of 84
Posted from my mobile device
poojakhanduja3017
Joined: 02 Dec 2018
Last visit: 01 Dec 2021
Posts: 123
Given Kudos: 36
Location: India
Schools: Goizueta '22 Wharton '22 IIMA PGPX "21 ISB '21 INSEAD Jan '20 LBS '22 Stanford '22 NUS '22 Booth '22 Cass '21
GMAT 1: 690 Q50 V32

GPA: 3.98
Schools: Goizueta '22 Wharton '22 IIMA PGPX "21 ISB '21 INSEAD Jan '20 LBS '22 Stanford '22 NUS '22 Booth '22 Cass '21
GMAT 1: 690 Q50 V32

Posts: 123
Kudos
Bookmarks
Interesting and Simple questions. All options have answer A
Will try to answer so that we don't have to actually solve.
1. Which year saw the greatest percent change in sales from the previous year?
A. 2004 to 2005
B. 2006 to 2007
C. 2007 to 2008
It was clearly A because it shows the greatest change. Had the options had 2008 to 2009, then also we would have gone by the same logic. We would have considered that in 2008-09, the previous was more giving a high denominator.
Question 2 : We can see that 4 values are well above $70M, hence the avg has to be more than $70M
Question 3: The sales in ascending order are 55,60,60,85, 87,95,95, Counting the fourth gives us 85 for 2006


