Events & Promotions
|
|

GMAT Club Daily Prep
Thank you for using the timer - this advanced tool can estimate your performance and suggest more practice questions. We have subscribed you to Daily Prep Questions via email.
Customized
for You
Track
Your Progress
Practice
Pays
Not interested in getting valuable practice questions and articles delivered to your email? No problem, unsubscribe here.
 Jun 04
08:30 AM PDT
-09:30 AM PDT
For most test takers, Data Insights is the most challenging section on the GMAT, with test takers scoring several points lower on average on DI than on Quant or Verbal and completing the section with less time to spare. May 29
10:00 AM IST
-11:00 PM IST
Start your journey with a fully customized action plan and work with a dedicated mentor to achieve a 735+ score.- Jun 03
08:30 AM PDT
-09:30 AM PDT
In Episode 7 of our GMAT Ninja CR series, we are rounding up the oddballs, the misfits, and the format-benders: EXCEPT, Fill-In-The-Blanks, and other unusual Critical Reasoning question types. When you see a question that ends with a literal blank line - Jun 10
06:00 AM PDT
-06:15 PM PDT
Register for the GMAT Club Virtual MBA Spotlight Fair – the world’s premier event for serious MBA candidates. This is your chance to hear directly from Admissions Directors at nearly every Top 30 MBA program..

Kudos
Bookmarks

New South Wales is typical in more categories than any other listed state/territory.: No
No listed state/territory is more geographically typical than South Australia.: Yes
The Australian Capital Territory is not typical in any of the categories.: Yes
Be sure to select an answer first to save it in the Error Log before revealing the correct answer (OA)!
Difficulty:
 95%
(hard)
95%
(hard)
Question Stats:
47% (03:14) correct 53%
(03:22)
wrong
based on 1655
sessions
53%
(03:22)
wrong
based on 1655
sessions
History
Date
Time
Result
Not Attempted Yet
With reference to this table, a statistician has proposed the following criteria for determining the “most geographically typical” of the listed Australian states/territories:
(Sort ↕ the table by clicking on the headers)
For each of the four categories of statistics, a state/territory is typical if and only if it is neither among the 25% of listed states/territories with the least values for that category nor among the 25% of listed states/territories with the greatest values for that category.
For each of the following statements, select Yes if the statement is accurate based on the statistician’s criteria; otherwise select No.
| State/territory | Land area (km^2) | Population (2006) | Population density (people/km^2) | % of population in capital |
|---|---|---|---|---|
| Australian Capital Territory | 2358 | 344200 | 137.53 | 99.6 |
| New South Wales | 800642 | 6967200 | 8.44 | 63 |
| Northern Territory | 1349129 | 219900 | 0.15 | 54 |
| Queensland | 1730648 | 4279400 | 2.26 | 46 |
| South Australia | 983482 | 1601800 | 1.56 | 73.5 |
| Tasmania | 68401 | 498200 | 7.08 | 41 |
| Victoria | 227416 | 5297600 | 22 | 71 |
| Western Australia | 2529875 | 2163200 | 0.79 | 73.4 |
For each of the four categories of statistics, a state/territory is typical if and only if it is neither among the 25% of listed states/territories with the least values for that category nor among the 25% of listed states/territories with the greatest values for that category.
For each of the following statements, select Yes if the statement is accurate based on the statistician’s criteria; otherwise select No.
| Yes | No | |
| New South Wales is typical in more categories than any other listed state/territory. | ||
| No listed state/territory is more geographically typical than South Australia. | ||
| The Australian Capital Territory is not typical in any of the categories. |
ShowHide Answer
Official Answer
New South Wales is typical in more categories than any other listed state/territory.: No
No listed state/territory is more geographically typical than South Australia.: Yes
The Australian Capital Territory is not typical in any of the categories.: Yes
Need more Tests to Practice?
GMAT Club Tests give expert solutions for every question in full and sectional GMAT Focus mocks.
Learn more →

This TA question comes with a simple table but an involved translation. To solve it efficiently, you need to:
As you watch the video solution, observe how absolute comfort in how to work with a table in a TA question is imperative for our goal of “owning the dataset”. Here, you sort by not one or two but all 4 columns to infer the information that is then used in each statement. Call the analysis of this question done once you have determined why you answered this question incorrectly or why you took longer to answer it. Most likely reasons:
- Translate the definition of “typical” into simpler terms using the strategic pausing technique. Doing this upfront ensures that evaluation of the statements is not a time hog.
- Make inferences when direct information is not provided. This is true about statement 2 in the question in which we needed to extend the given definition of “typical” to find the “most geographically typical” state/territory.
- Determine the approach to evaluate each statement before plunging into the 32 data points in the table. This is to keep you focused on just what is needed. Observe how we used tally marks to solve one of the statements and how that same tally chart was used in the rest of the statements as well. So, do not shy away from doing the work that is expected to answer each statement. And do not think that same amount of work will be required for all statements. Be open to reusing the analysis that you have done for the statements.
As you watch the video solution, observe how absolute comfort in how to work with a table in a TA question is imperative for our goal of “owning the dataset”. Here, you sort by not one or two but all 4 columns to infer the information that is then used in each statement. Call the analysis of this question done once you have determined why you answered this question incorrectly or why you took longer to answer it. Most likely reasons:
- You did not translate the meaning of “typical”.
- You did not create your own table with tally marks for the states that are “typical”.


Kudos
Bookmarks
Official Explanation
RO1: Apply
There are eight listed states and territories, so when the table is sorted in ascending order in any category, the four states and territories appearing in rows 3–6 are precisely those states considered typical in that category. The following table lists the typical states and territories, by category:
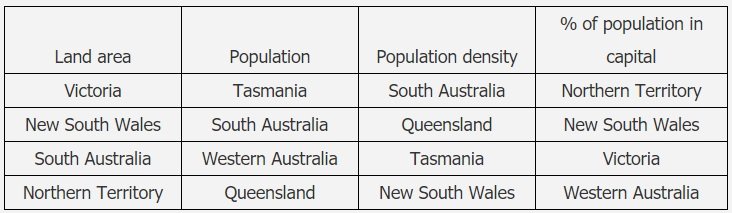
Although no other states and territories are typical in more than two categories, both New South Wales and South Australia are typical in exactly three categories. Therefore New South Wales is not typical in more categories than the other listed states and territories.
The correct answer is No.
RO2: Apply
According to the table produced in the analysis of RO1, both South Australia and New South Wales are more typical than every other listed state or territory; so there is no listed state or territory that is more typical than South Australia.
The correct answer is Yes.
RO1: Apply
There are eight listed states and territories, so when the table is sorted in ascending order in any category, the four states and territories appearing in rows 3–6 are precisely those states considered typical in that category. The following table lists the typical states and territories, by category:
Although no other states and territories are typical in more than two categories, both New South Wales and South Australia are typical in exactly three categories. Therefore New South Wales is not typical in more categories than the other listed states and territories.
The correct answer is No.
RO2: Apply
According to the table produced in the analysis of RO1, both South Australia and New South Wales are more typical than every other listed state or territory; so there is no listed state or territory that is more typical than South Australia.
The correct answer is Yes.
Attachment:
1.jpg [ 57.18 KiB | Viewed 19019 times ]