Events & Promotions
| Last visit was: 20 Sep 2026, 18:28 |
It is currently 20 Sep 2026, 18:28 |
|
|

GMAT Club Daily Prep
Thank you for using the timer - this advanced tool can estimate your performance and suggest more practice questions. We have subscribed you to Daily Prep Questions via email.
Customized
for You
Track
Your Progress
Practice
Pays
Not interested in getting valuable practice questions and articles delivered to your email? No problem, unsubscribe here.
 Sep 21
09:30 AM EDT
-10:00 AM EDT
Meet Tuck at an informal student or staff-hosted coffee chat in a city near you! Sep 20
09:30 AM EDT
-12:30 PM EDT
Top scores are possible when you enroll in a powerful EA course, taught live online + 6 months access to TTP OnDemand video courses included! Perfect class schedule and easy course access for working professionals. Class starts Sundays Sept. 20th Sep 23
09:00 AM PDT
-09:00 AM PDT
What’s in it for you - Live Profile Evaluation Chat Session with Jenifer Turtschanow, CEO, ARINGO. Come with your details prepared and ARINGO will share insights! Pre-MBA Role/Industry, YOE, Exam Score, C/GPA, ECs Post-MBA Role/ Industry & School List. Sep 24
09:00 PM IST
-10:00 PM IST
M7 admission isn't luck, and it isn't just your GMAT score. Join our free webinar for a direct, insider breakdown of what it actually takes to get into Harvard, Stanford, Wharton, Kellogg, Booth, Columbia, MIT — led by an INSEAD alum with a real M7... Sep 25
08:30 AM EDT
-09:30 AM EDT
Get the inside scoop on what makes Emory’s Goizueta Business School great and how you can present a strong MBA application. Explore the difference between our One-Year MBA and Two-Year MBA programs, talk to our admissions team, and meet students. Sep 26
08:00 PM PDT
-09:00 PM PDT
Inquire for a free profile evaluation and guarantee statement for possible admits and scholarships!

shailhills
GMAT Forum Director
Joined: 30 Jul 2025
Last visit: 18 Sep 2026
Posts: 158
Given Kudos: 53
Location: India
Concentration: Strategy, Operations
Schools: Kellogg '27
GMAT 1: 740 Q51 V39 (Online)
 Updated on: 10 Sep 2026, 01:54
Originally posted by shailhills on 26 Aug 2010, 04:35.
Last edited by Nikhil on 10 Sep 2026, 01:54, edited 219 times in total.
Last edited by Nikhil on 10 Sep 2026, 01:54, edited 219 times in total.
Table updated with FT 2026 Rankings
Kudos
Bookmarks
Official PostAll MBA Rankings: 2025
Welcome to the MBA rankings thread. Below you will find links of the various ranking lists. e.g. Full time, part time, international, etc. Click on the respective link to see that ranking.
- GMAT Club / US News / FT MBA Rankings
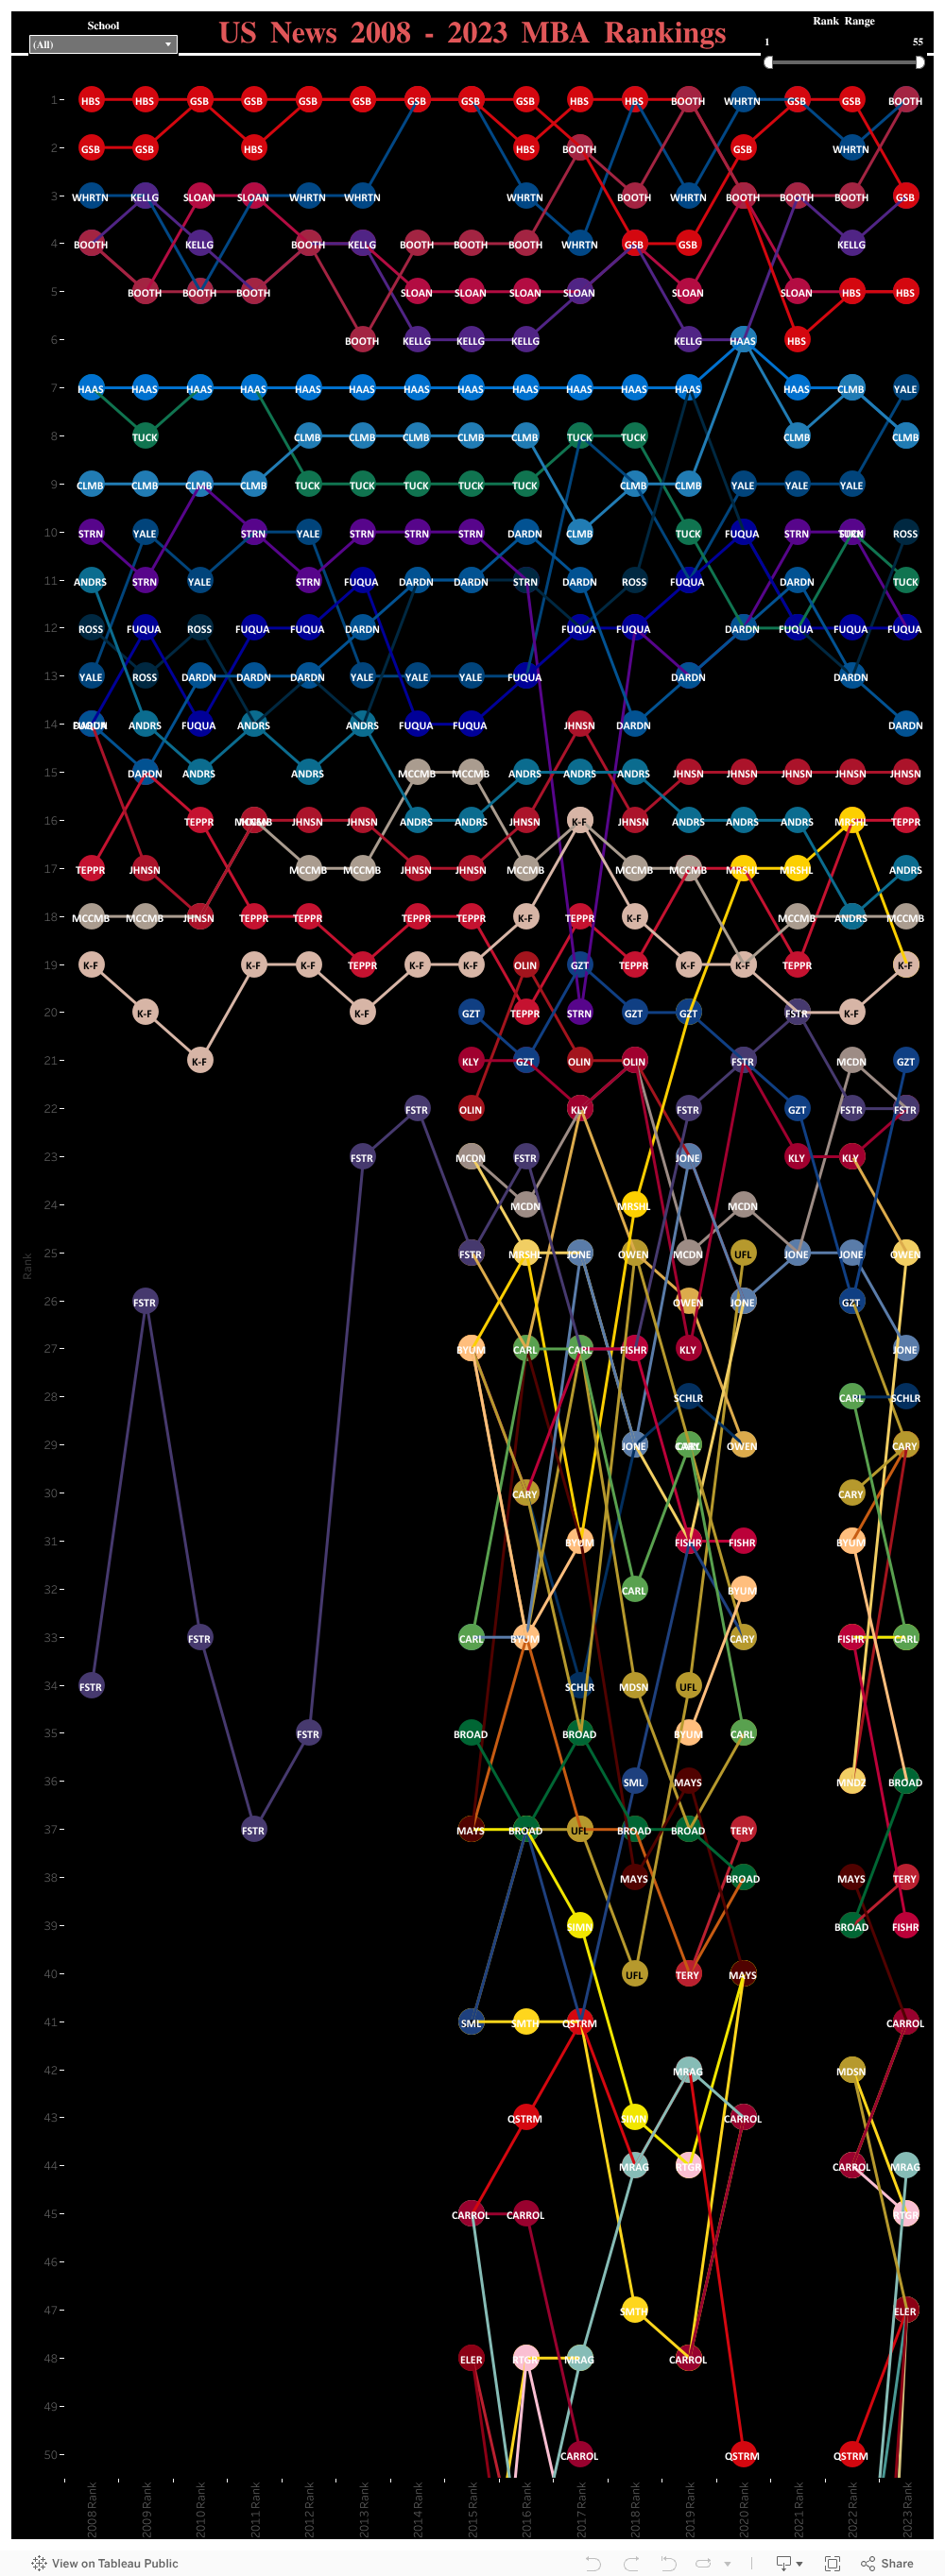
- 12 Years of Historic US News Rankings
- International Business School Rankings
- Part Time MBA Rankings
- Executive MBA Rankings
- Online MBA Rankings
- Best European MBA Programs
- Best Asian MBA Programs
- Rankings by MBA Specialization - US Business Schools
For Latest Class Profiles of Top Business Schools, Visit this Thread
GMAT Club MBA Rankings 2026-2027 – Top 25
| Rank | School | Final Score |
| 1 | University of Pennsylvania (Wharton) | 95.50 |
| 2 | Stanford University | 95.03 |
| 3 | Harvard University | 95.01 |
| 4 | University of Chicago (Booth) | 93.69 |
| 5 | Northwestern University (Kellogg) | 93.18 |
| 6 | MIT (Sloan) | 92.34 |
| 7 | Columbia University | 92.14 |
| 8 | NYU (Stern) | 91.67 |
| 9 | UC Berkeley (Haas) | 90.29 |
| 10 | Dartmouth (Tuck) | 90.12 |
| 11 | University of Michigan (Ross) | 88.21 |
| 12 | Yale University (SOM) | 88.15 |
| 13 | University of Virginia (Darden) | 87.58 |
| 14 | Duke University (Fuqua) | 86.75 |
| 15 | Carnegie Mellon (Tepper) | 81.47 |
| 16 | Cornell University (Johnson) | 81.40 |
| 17 | Vanderbilt University (Owen) | 80.65 |
| 18 | UT Austin (McCombs) | 80.55 |
| 19 | Emory University (Goizueta) | 79.91 |
| 20 | UCLA (Anderson) | 79.88 |
| 21 | USC (Marshall) | 79.45 |
| 22 | Georgia Tech (Scheller) | 78.92 |
| 23 | University of Georgia (Terry) | 78.64 |
| 24 | UNC (Kenan-Flagler) | 78.39 |
| 25 | Indiana University (Kelley) | 77.73 |
Full top 50: gmatclub.com/blog/mba-rankings-2026
GMAT Club MBA Rankings 2026-2027: Key Highlights
- Wharton takes the top spot at 95.50, followed by Stanford at 95.03 and Harvard at 95.01 — all three functionally tied within half a point.
- The entire M7 fits inside a 3.36-point band; Booth and Kellogg are nearly tied at the second tier, Columbia and Sloan at the third.
- Scored on a clean 0-100 scale where the score reflects the share of total available points captured, not a relative gap between schools.
- Starting compensation (salary + bonus) leads with Stanford at ~$206,200, Wharton at ~$201,900, NYU Stern at ~$201,100, and Booth at ~$201,000.
- Median GMAT scores are tightly bunched at the top: Stanford and Columbia lead at 695, with the M7 average at 684.
The 2026 U.S. News & World Report Top 25 Best Business Schools (Full-Time MBA)
Released April 7, 2026
| Rank | School | GMAT (Classic) | Acceptance Rate |
| 1 | Stanford GSB | 738 | 6.8% |
| 2 | Wharton (UPenn) | 733 | 18.6% |
| 3 | Chicago Booth | 732 | 27.3% |
| 4 (tie) | Harvard Business School | 730 | Not reported |
| 4 (tie) | Northwestern Kellogg | 733 | 28.1% |
| 6 | MIT Sloan | 730 | 18.8% |
| 7 (tie) | Columbia Business School | 729 | 25.7% |
| 7 (tie) | NYU Stern | 733 | 23.6% |
| 9 | Dartmouth Tuck | 726 | 28.3% |
| 10 | UC Berkeley Haas | 729 | 21.4% |
| 11 (tie) | UVA Darden | 715 | 30.7% |
| 11 (tie) | Yale SOM | 725 | 28.5% |
| 13 | Michigan Ross | 720 | 30.2% |
| 14 | Duke Fuqua | 713 | 24.0% |
| 15 | Cornell Johnson | 710 | 29.3% |
| 16 (tie) | CMU Tepper | 705 | 24.3% |
| 16 (tie) | Vanderbilt Owen | 680 | 36.2% |
| 18 (tie) | UCLA Anderson | 716 | 31.0% |
| 18 (tie) | UT Austin McCombs | 704 | 32.7% |
| 20 | UW Foster | 704 | 33.6% |
| 21 (tie) | Indiana Kelley | 667 | 26.6% |
| 21 (tie) | UNC Kenan-Flagler | 696 | 37.9% |
| 23 (tie) | Emory Goizueta | 700 | 33.2% |
| 23 (tie) | UT Dallas Jindal | — | 35.5% |
| 25 (tie) | UGA Terry | — | 23.9% |
| 25 (tie) | USC Marshall | 716 | 31.4% |
Key Highlights for This Year:
- Stanford Reclaims #1: After sharing the top spot in 2025, Stanford GSB returns to a sole #1 in 2026; Wharton drops to #2.
- Biggest Mover: NYU Stern posts the largest top-10 GMAT gain (+10 points to 733) and jumps into a tie with Columbia at #7.
- Harvard's GMAT Dip: HBS's average GMAT fell 10 points (740 → 730), reflecting a deliberate shift toward holistic review rather than declining applicant quality.
- Selectivity: Stanford's 6.8% acceptance rate remains roughly a third of the next most selective M7 school (Wharton, 18.6%). Harvard did not report an acceptance rate this cycle.
- Methodology: US News continues to weight placement outcomes (employment rates and starting salary) heavily, which is producing more ties at the top of the list (#4, #7, #11, #16, #18, #21, #23, #25 are all ties this year).
FT Global MBA Ranking 2026 – Top 50
| Rank 2026 | Institution | Country | Rank 2025 | YoY Change |
| 1 | MIT Sloan | US | 6 | +5 |
| 2 | INSEAD | France | 4 | +2 |
| 3 | Wharton | US | 1 | -2 |
| 4 | IESE Business School | Spain | 3 | -1 |
| 4 | London Business School | UK | 7 | +3 |
| 6 | HEC Paris | France | 9 | +3 |
| 7 | ESADE Business School | Spain | 8 | +1 |
| 8 | CEIBS | China | 12 | +4 |
| 9 | Berkeley Haas | US | 15 | +6 |
| 10 | Harvard Business School | US | 13 | +3 |
| 11 | Northwestern Kellogg | US | 10 | -1 |
| 12 | Nanyang Business School (NTU) | Singapore | 22 | +10 |
| 12 | Indian School of Business | India | 27 | +15 |
| 14 | Peking University Guanghua | China | 25 | +11 |
| 15 | Cornell Johnson | US | 13 | -2 |
| 16 | Duke Fuqua | US | 11 | -5 |
| 17 | Cambridge Judge | UK | 35 | +18 |
| 17 | Yale School of Management | US | 24 | +7 |
| 19 | Virginia Darden | US | 20 | +1 |
| 20 | Chicago Booth | US | 17 | -3 |
| 21 | IE Business School | Spain | 18 | -3 |
| 22 | ESCP Business School | France | 28 | +6 |
| 23 | NYU Stern | US | 31 | +8 |
| 24 | ESSEC Business School | France | 47 | +23 |
| 24 | HKUST Business School | Hong Kong | 36 | +12 |
| 26 | Dartmouth Tuck | US | 20 | -6 |
| 27 | IIM Ahmedabad | India | 31 | +4 |
| 27 | Oxford Saïd | UK | 26 | -1 |
| 29 | NUS Business School | Singapore | 37 | +8 |
| 30 | Fudan School of Management | China | 30 | 0 |
| 30 | IMD | Switzerland | 22 | -8 |
| 32 | UCLA Anderson | US | 19 | -13 |
| 33 | HKU Business School | Hong Kong | 41 | +8 |
| 34 | Michigan Ross | US | 29 | -5 |
| 34 | IIM Bangalore | India | 57 | +23 |
| 36 | Shanghai U College of Business | China | 15 | -21 |
| 37 | Washington University Olin | US | 42 | +5 |
| 38 | Rice Jones | US | 39 | +1 |
| 39 | Imperial Business School | UK | 38 | -1 |
| 40 | UNC Kenan-Flagler | US | 51 | +11 |
| 41 | emlyon Business School | France | 44 | +3 |
| 41 | CMU Tepper | US | 49 | +8 |
| 41 | Texas McCombs | US | 39 | -2 |
| 44 | Georgia Tech Scheller | US | 58 | +14 |
| 45 | Washington Foster | US | 34 | -11 |
| 46 | USC Marshall | US | 50 | +4 |
| 47 | EDHEC Business School | France | 64 | +17 |
| 48 | AGSM at UNSW | Australia | 67 | +19 |
| 49 | Alliance Manchester Business School | UK | 46 | -3 |
| 49 | Georgetown McDonough | US | 43 | -6 |
FT Global MBA Ranking 2026: The Big Shifts
- MIT Sloan claims #1 for the first time, jumping five spots.
- INSEAD moves to #2.
- After two years on top, Wharton drops to #3.
Why Sloan's Rise Makes Sense
Business has tilted toward AI, analytics, and digital transformation. Sloan's technical depth isn't new. The market finally caught up. Analytical rigor and tech fluency are now baseline leadership skills.
Europe Is Holding Strong
- IESE and London Business School tie at #4
- HEC Paris at #6
- ESADE at #7
The US: Gains and Gaps
- Berkeley Haas climbs to #9
- Harvard Business School returns to the top 10 at #10, with the highest 3-year alumni salary: $261,196
- But Stanford GSB and Columbia are absent due to alumni survey thresholds.
Asia's Momentum Is Real
- CEIBS enters the top 10 at #8
- Nanyang (NTU) jumps to #12
- ISB surges 15 spots to #12
- Peking Guanghua reaches #14
- CEIBS reports 156% salary growth post-MBA.
- Twelve Asian schools now sit in the top 36.
Employment Still Holds
Despite market volatility, many top schools report 90%+ employment within three months. The MBA ROI remains intact.
New Metric, Big Debate
FT added Sector Diversity (variety of pre-MBA industries). Surprisingly, elite schools rank low, while schools like Ivey and BYU top the list.
What This Ranking Signals
- Tech-forward leadership is winning
- Asia is a heavyweight, not a challenger
- Employment resilience remains strong


 31 Jul 2021, 09:01
Kudos
Bookmarks
sant13osh
You can search for it! 😂
https://gmatclub.com/forum/average-gmat ... 54237.html
Posted from my mobile device

MikeScarn
Current Student
Joined: 04 Sep 2017
Last visit: 10 Sep 2026
Posts: 262
Given Kudos: 227
Location: United States (IL)
Concentration: Technology, Leadership
Schools: Tuck '24 (WA) Harvard '24 (D) Kellogg '24 (WA) Wharton '24 (D) Haas '24 (D) Sloan '24 (D) Fuqua '24 (D) Booth '24 (M) Yale '24 (A$)
GMAT 1: 690 Q44 V41
GMAT 2: 730 Q50 V38
GPA: 3.62
WE:Sales (Computer Software)
Schools: Tuck '24 (WA) Harvard '24 (D) Kellogg '24 (WA) Wharton '24 (D) Haas '24 (D) Sloan '24 (D) Fuqua '24 (D) Booth '24 (M) Yale '24 (A$)
GMAT 2: 730 Q50 V38
Posts: 262
28 Mar 2022, 17:44
Kudos
Bookmarks
2023 Rankings just came out.
https://www.usnews.com/best-graduate-schools/top-business-schools/mba-rankings
https://www.usnews.com/best-graduate-schools/top-business-schools/mba-rankings
- #1 Booth
#1 Wharton
#3 Kellogg
#3 Stanford
#5 Harvard
#5 Sloan
#7 Yale SOM
#8 Columbia
#8 Haas
#10 Ross
#11 Tuck
#12 Fuqua
#12 Stern
#14 Darden
#15 Johnson
#16 Tepper
#17 Anderson
#18 McCombs
#19 Kenan-Flagler
#19 USC Marshall
28 Mar 2022, 17:50
Kudos
Bookmarks
Interesting!
Nice to Ross do well in the top 10. Good for them!
Interesting that Yale has gone to spot seven. I also feel vindicated about USC being almost out of top 20. I have a feeling it will go back to mid 20s.
Posted from my mobile device
Nice to Ross do well in the top 10. Good for them!
Interesting that Yale has gone to spot seven. I also feel vindicated about USC being almost out of top 20. I have a feeling it will go back to mid 20s.
MikeScarn
Posted from my mobile device