

 Sign in with Google
 Sign in with Apple

The GMAT Club MBA Rankings 2026 - 2027
Top 50 US Full-Time MBA Programs
Today we are releasing the GMAT Club Ranking of the top 50 US full-time MBA programs for 2026. This is our community's own take on how the leading programs stack up, scored on a clean 0 to 100 scale where a perfect program would earn 100.
A quick look at how the table reads this year. And here is last year's 2025 rankings for reference.
The Top 3
Wharton takes the top spot at 95.50, followed by Stanford at 95.03 and Harvard at 95.01. All three sit within half a point of each other, which tells you the real story at the top: these three programs are functionally tied, and any of them is a strong choice for an applicant who can get in. Wharton edges ahead this year on the strength of a balanced profile across every input we measure.
The M7
The full M7 ordering for 2026:
| Rank | School | Final Score |
|---|---|---|
| 1 | University of Pennsylvania (Wharton) | 95.50 |
| 2 | Stanford University | 95.03 |
| 3 | Harvard University | 95.01 |
| 4 | University of Chicago (Booth) | 93.69 |
| 5 | Northwestern University (Kellogg) | 93.18 |
| 6 | Massachusetts Institute of Technology (Sloan) | 92.34 |
| 7 | Columbia University | 92.14 |
The entire M7 fits inside a 3.36-point band. Booth and Kellogg are nearly tied at the second tier. Columbia and Sloan are essentially indistinguishable at the third.
The Top 10
Beyond the M7, NYU Stern lands at #8 with a score of 91.67, Berkeley Haas at #9 with 90.29, and Dartmouth Tuck at #10 with 90.12. Stern's outcomes profile is the strongest of the three. Haas and Tuck round out the top 10 with very different profiles but nearly identical final scores.
| Rank | School | Score |
| 8 | Stern (NYU) | 91.67 |
| 9 | Haas (Berkeley) | 90.29 |
| 10 | Tuck (Dartmouth) | 90.12 |
The Top 15
The next five fill out the elite tier:
| Rank | School | Final Score |
|---|---|---|
| 11 | University of Michigan, Ross | 88.21 |
| 12 | Yale University, School of Management | 88.15 |
| 13 | University of Virginia, Darden | 87.58 |
| 14 | Duke University, Fuqua | 86.75 |
| 15 | Carnegie Mellon University, Tepper | 81.47 |
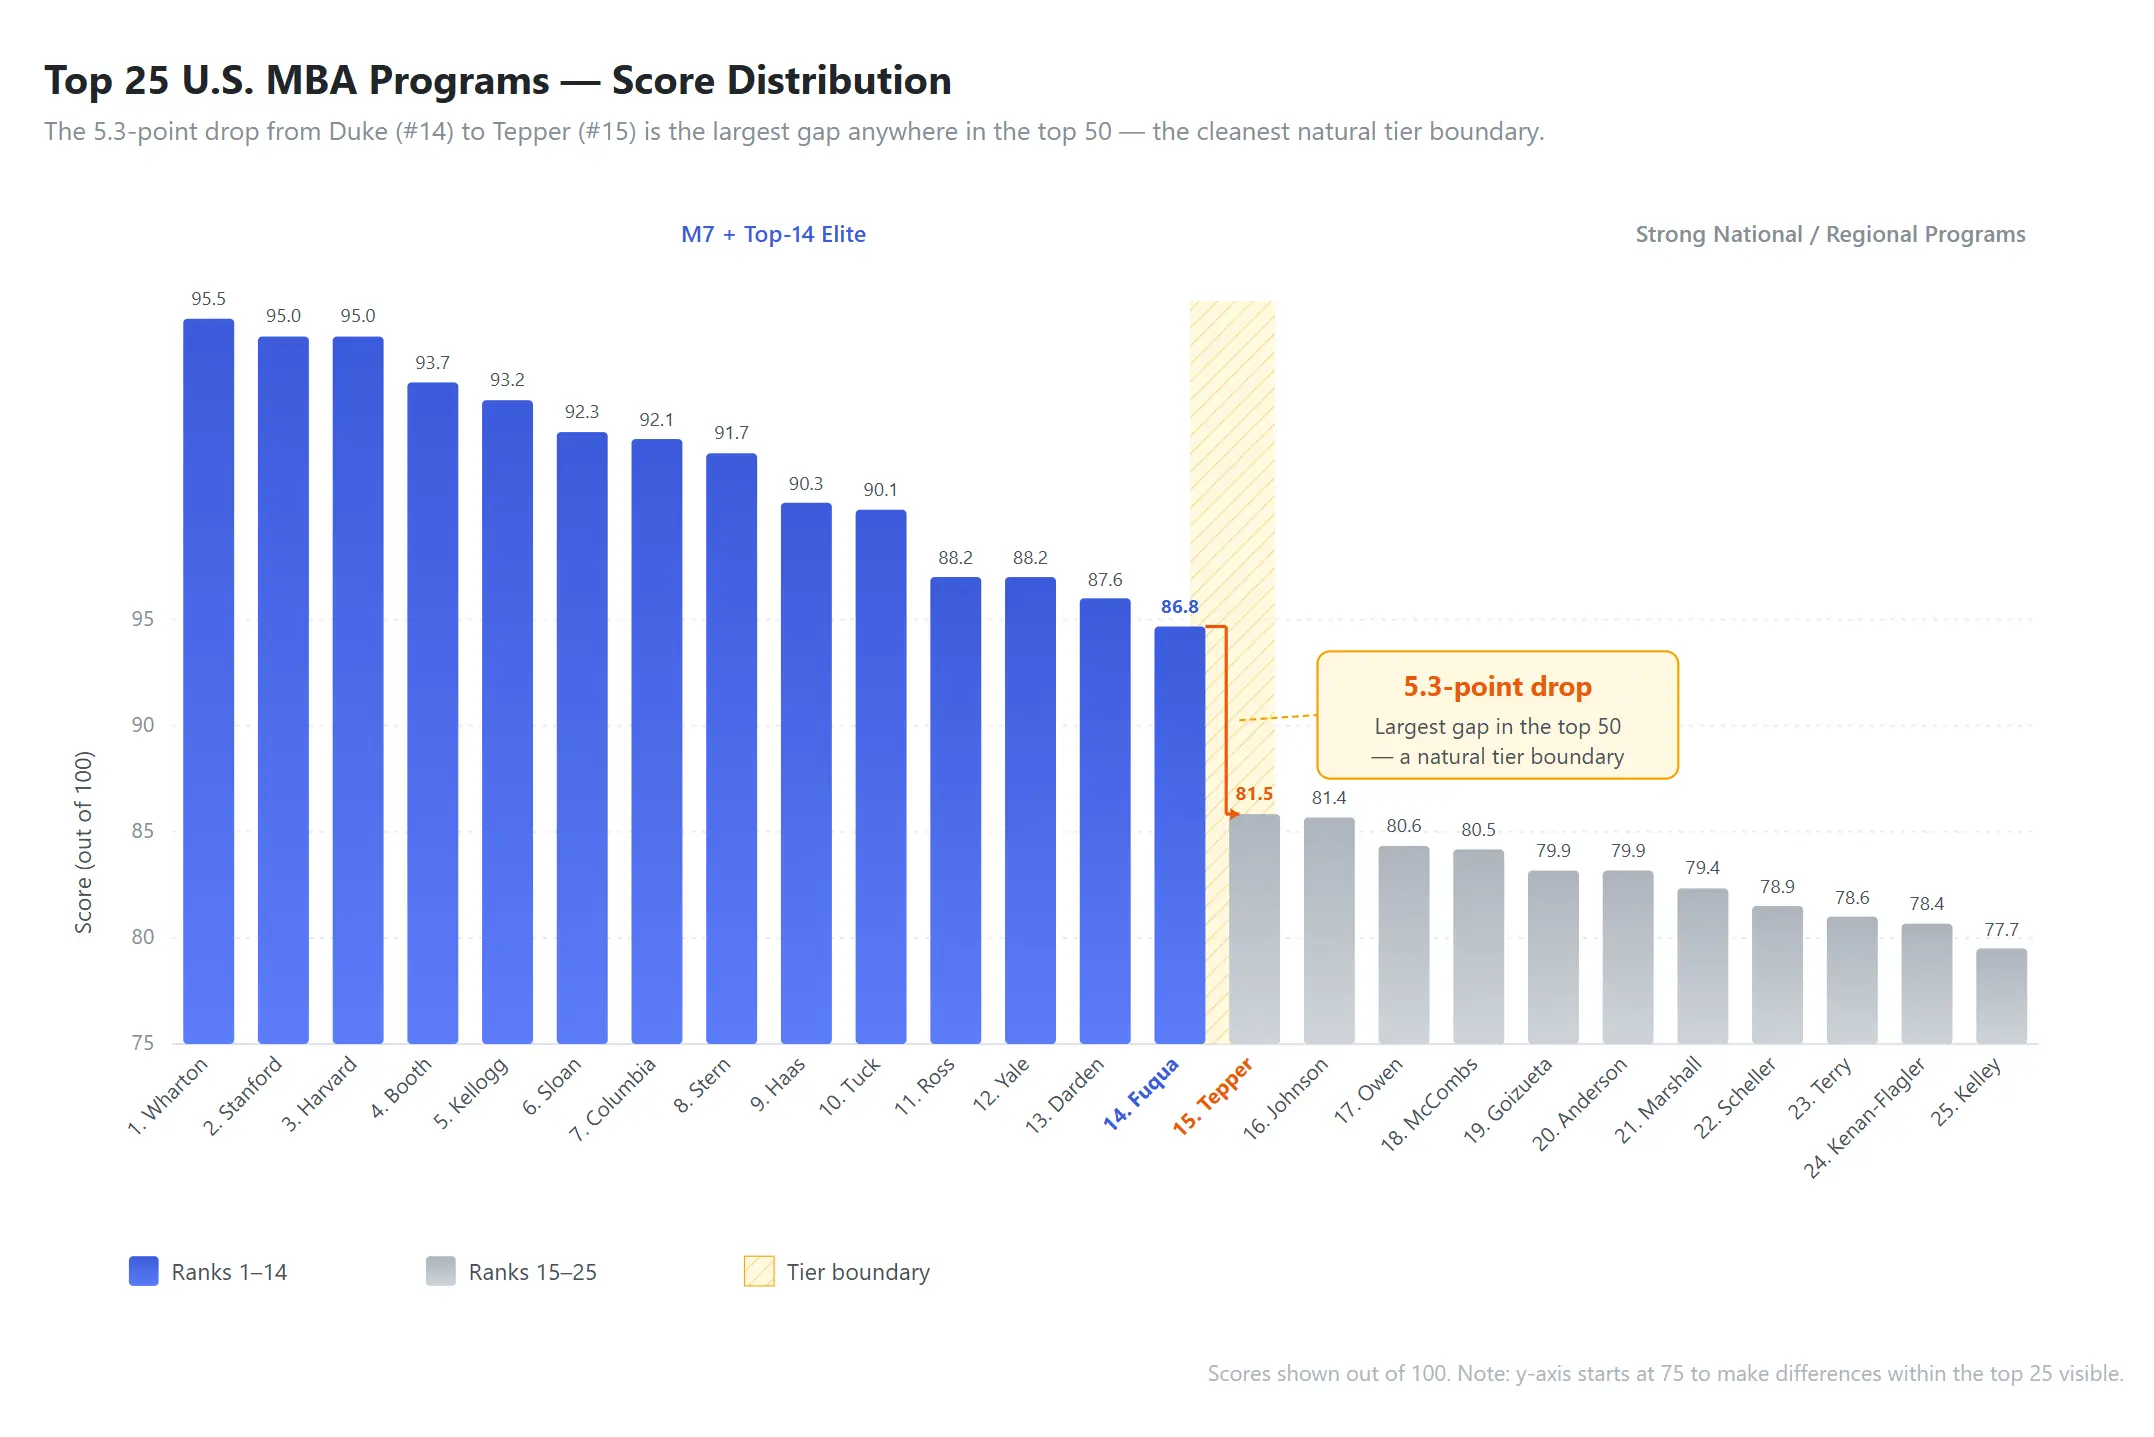
The gap between Duke at #14 and Tepper at #15 is the single largest score drop anywhere in the top 50, more than 5 full points. This is the cleanest natural tier boundary in the ranking, and a useful way to think about where the most competitive national programs end.
Ranks 16 to 25
This is the densest part of the table, with ten programs packed inside a roughly 3-point band:
| Rank | School | Final Score |
|---|---|---|
| 16 | Cornell University, Johnson | 81.40 |
| 17 | Vanderbilt University, Owen | 80.65 |
| 18 | University of Texas at Austin, McCombs | 80.55 |
| 19 | Emory University, Goizueta | 79.91 |
| 20 | University of California, Los Angeles, Anderson | 79.88 |
| 21 | University of Southern California, Marshall | 79.45 |
| 22 | Georgia Institute of Technology, Scheller | 78.92 |
| 23 | University of Georgia, Terry | 78.64 |
| 24 | University of North Carolina, Kenan-Flagler | 78.39 |
| 25 | Indiana University, Kelley | 77.73 |
Programs in this band are highly competitive with each other on the underlying numbers, and applicants choosing among them will generally do better focusing on fit, location, and target industry than on small differences in rank.
Ranks 26 to 50
| Rank | School | Final Score |
|---|---|---|
| 26 | University of Washington, Foster | 77.06 |
| 27 | University of Texas at Dallas, Jindal | 74.76 |
| 28 | Ohio State University, Fisher | 74.69 |
| 29 | Washington University in St. Louis, Olin | 74.44 |
| 30 | Arizona State University, W. P. Carey | 74.09 |
| 31 | Texas A&M University, Mays | 72.70 |
| 32 | University of Rochester, Simon | 72.31 |
| 33 | University of Notre Dame, Mendoza | 72.09 |
| 34 | Rice University, Jones | 71.77 |
| 35 | University of Florida, Warrington | 70.78 |
| 36 | Georgetown University, McDonough | 70.40 |
| 37 | Southern Methodist University, Cox | 69.55 |
| 38 | University of Minnesota, Carlson | 67.90 |
| 39 | Iowa State University, Ivy | 67.61 |
| 40 | University of Miami, Herbert | 67.49 |
| 41 | Michigan State University, Broad | 67.01 |
| 42 | Brigham Young University, Marriott | 65.96 |
| 43 | American University, Kogod | 65.88 |
| 44 | University of Utah, Eccles | 64.19 |
| 45 | University of Pittsburgh, Katz | 63.76 |
| 46 | University of Tennessee, Haslam | 63.73 |
| 47 | University of Arkansas, Walton | 63.69 |
| 48 | Boston University, Questrom | 63.65 |
| 49 | University of Wisconsin, Madison | 63.17 |
| 50 | University of Maryland, Smith | 62.91 |
The bottom of the top 50 compresses tightly. The final five programs all score within 0.82 points of each other, which means precise ordering at this end carries less signal than the broader tier placement.
What the numbers say about the class of 2026
Beyond the final scores, the underlying data reveals patterns that are useful for anyone weighing where to apply or matriculate. Here is what the inputs to the ranking tell us about this year's MBA landscape.
Starting compensation
Starting compensation, defined as starting salary plus signing bonus, remains the clearest dividing line at the top of the table. Stanford leads at roughly $206,200, followed by Wharton at $201,900, NYU Stern at $201,100, and Booth at $201,000. These four programs make up the $200K club this year. The full M7 averages just under $199,600 in starting compensation, and the top 10 averages $198,400, meaning the gap between #1 and #10 on this metric is narrower than many applicants assume.
The picture changes as you move down the table. The 16 to 25 band averages roughly $171,100, which is around $27,000 below the top 10. Programs ranked 26 to 50 average roughly $137,100, putting the spread from the M7 to the bottom half of the top 50 at over $62,000 per year. For an applicant comparing schools on financial return, this gap is the single largest factor in any honest payback calculation.
Average base salary
If you strip out bonuses and look only at base salary, the rank order at the top shuffles slightly. Stanford leads at $190,100, followed by Harvard at $180,900 and Wharton at $179,900. Sloan, Booth, and Columbia all fall in the $170,000 to $173,000 range. Kellogg and Tuck both come in around $167,000 to $168,000. The M7 base salary average is $176,300 and the top 10 average is $173,600, again very tight at the top.
Base salary tends to be a more conservative indicator than total compensation because it strips out year-one variability. Applicants weighing offers should keep both numbers in mind.
Employed at graduation
Employment rate at graduation is one of the more counterintuitive metrics in the data. The leaders are not the M7. Georgia Terry posts the highest rate at 86.7%, followed by Iowa State Ivy at 86.3% and Virginia Darden at 80.1%. UT Dallas Jindal and Vanderbilt Owen round out the top five at 78.7% and 78.5%.
The M7 average sits at 66.6%, and Stanford in particular comes in at 55.7%, well below the rest of the M7. This is a known pattern: Stanford and a few peer schools send a meaningful share of graduates into startups, search funds, and self-directed paths where a traditional offer is not in hand on graduation day. Applicants targeting consulting or banking should weight this number heavily. Applicants targeting entrepreneurship or venture should weight it lightly.
Employed three months after graduation
Three-month employment rates compress the differences. Iowa State Ivy leads at 94.5%, followed by UT Dallas Jindal at 93.6% and Georgia Terry at 93.3%. Among the elite programs, Darden reaches 89.7%, Columbia 88.4%, and Tuck 87.7%. The M7 average is 84.4%, and the top 15 average is 84.3%, essentially identical.
The takeaway: nearly every program in the top 50 places the vast majority of its graduates within three months. The real differentiation is in what kind of role at what level of compensation, not whether graduates find work at all.
Academic profile of admitted students
Median GMAT scores at the top are remarkably bunched. Stanford and Columbia lead at 695. Arizona State Carey reports 690. Harvard, Kellogg, and Ross all sit at 685. Wharton comes in at 676. The M7 average is 684 and the top 10 average is 681. For an applicant building a GMAT target, a score in the high 670s to mid 690s puts you at the median of every elite program.
Median undergraduate GPAs are even tighter. Stanford and Kellogg lead at 3.8, with most of the top 10 sitting at 3.7. GPA matters at the margin, especially for younger applicants, but it is not a significant differentiator among elite programs.
Funny fact – USC Marshall also reports an average GMAT Classic score of 742 on their website, equivalent to about 685 on GMAT Focus. Treat it with a grain of salt as a range of sub Top 15 schools have been using test-optional admissions to beef up their “average” scores by shrinking the reporting pool.
Selectivity
Acceptance rates remain dominated by the very top. Stanford accepts 6.8% of applicants. Harvard accepts 11.2%. Beyond those two, a handful of mid-table programs post acceptance rates as low or lower, often driven by smaller applicant pools rather than higher quality bars. The M7 average is 19.5%, the top 10 average is 21.0%, and the top 15 average is 23.5%. Most elite programs accept between one in four and one in five applicants.
Reputation among peers and recruiters
Reputation scores are the most concentrated category in the entire ranking. On peer assessment, Stanford and Harvard tie at the top with 4.8 out of 5, followed by Wharton, Booth, and Sloan at 4.7, and Kellogg and Haas at 4.5. On recruiter assessment, Wharton stands alone at 4.6, with Stanford, Harvard, Booth, and Kellogg tied at 4.5. No school outside the M7 plus Haas reaches 4.5 on either dimension. For applicants whose careers depend on signaling to a broad set of employers, the reputation gap between the M7 and the next tier is real and worth weighting.
International student composition
International enrollment varies more than most applicants realize. Maryland Smith leads at 65.4%, followed by BU Questrom at 61.8%, Rochester Simon at 52.3%, and Washington Foster at 51.4%. Among elite programs, Columbia reports 46.0%, Kellogg 40.0%, MIT Sloan 41.3%, and Berkeley Haas 40.7%. Wharton sits at 27.8%, Harvard at 35.0%, and Stanford at 41.6%.
These are very different experiences if you have 60% vs. 30% of your class being international. You can choose what experience you prefer - both have pros and cons.
Moreover, International applicants weighing visa risk and post-MBA placement in the US should look closely at this number alongside post-MBA outcomes for international hires specifically, which is a level of detail not captured in any aggregate ranking and worth requesting directly from each program.
A few cross-cutting observations
The data surface a few patterns worth flagging:
Salary scales tightly at the top and loosens quickly. The M7 fits inside a $10,800 starting compensation band, but the gap between the M7 average and the 26 to 50 average is roughly $62,500. Among elite programs, salary is a small differentiator. Across the full top 50, it is the largest.
Employment rate at graduation is a noisy metric. It is heavily influenced by program career path mix. Use it as one input, not a tiebreaker, and pair it with three-month employment for a fuller picture.
Academic medians are converging. With most elite programs landing within five GMAT points and one tenth of a GPA point of each other, academic profile is rarely the deciding factor in admissions outcomes at the top. Fit, story, and goals are.
Reputation remains concentrated. The single sharpest discontinuity in the underlying data is the gap between M7 reputation scores and everyone else. For career paths where employer perception matters disproportionately, this is worth weighing.
How to read these ranking
Where are the international MBA Programs?
We have not been able to find a good solution to include international MBA programs into the GMAT Club rankings as most international MBA Programs do not provide the granularity of the detail that the US programs do. For example - have you been able to find the average GMAT score for LBS? Exactly - many of the top European programs do not disclose even the most basic of their stats and we take a lot into consideration than just the average GMAT and thus it is currently not possible to rank international MBA programs.
A few things worth keeping in mind as you use these numbers:
The scale is absolute, not relative. A score of 95.50 means Wharton captured 95.50% of all available points, not that it is 1% better than Stanford. This also means year over year comparisons stay meaningful.
Tiers matter more than precise ranks. Wharton at #1 and Stanford at #2 are functionally tied. The same is true of Booth and Kellogg, of Columbia and Sloan, and of most adjacent pairs in the bottom half. Use the tiers we have called out above as your real decision framework.
Fit beats rank. Especially in the 16 to 50 range, the score gaps between adjacent schools are small enough that program fit, geography, scholarship offers, and target industry should drive your final choice.
We are grateful to the GMAT Club community for years of data, feedback, and rigorous debate that have shaped this ranking. We will continue to refine the methodology and welcome your comments below.
Congratulations to all the programs that made this year's top 50.
