Events & Promotions
|
|

GMAT Club Daily Prep
Thank you for using the timer - this advanced tool can estimate your performance and suggest more practice questions. We have subscribed you to Daily Prep Questions via email.
Customized
for You
Track
Your Progress
Practice
Pays
Not interested in getting valuable practice questions and articles delivered to your email? No problem, unsubscribe here.
 Jun 03
10:00 AM PDT
-11:00 AM PDT
Short-answer questions are often the most overlooked part of MBA applications — but they can quietly become one of the strongest ways to differentiate yourself. In this video, we break down why short-answer prompts matter, and more.... Jun 03
11:00 AM EDT
-12:00 PM EDT
Free Webinar. Only 10 weeks until the Kellogg EMBA August deadline! Learn key steps for earning a large scholarship there. Presented by Dr. Shelle, a Harvard and Oxford graduate and EMBA expert. Jun 04
10:00 AM EDT
-10:30 AM EDT
Most MBA applicants treat the essay prompt as a question to answer. It isn't. The prompts at M7 and T10 programs are open-ended by design — watching what candidates choose to say when almost anything is fair game. That choice is a strategic decision, and Jun 06
11:00 AM PDT
-11:00 AM PDT
The old MBA recruiting playbook is dead. Here’s how top admits are getting ahead this summer. Jun 08
04:00 PM PDT
-05:00 PM PDT
Inquire for a free profile evaluation and guarantee statement for possible admits and scholarships! Jun 09
11:00 AM EDT
-12:00 PM EDT
Download the MBA Launchpad App, for FREE access to the largest MBA database - Data backed read on your profile - Identify gaps before you apply - Build a balanced school list - Track your deadlines - Mock interviews - Extensive content library- Jun 10
06:00 AM PDT
-06:15 PM PDT
Register for the GMAT Club Virtual MBA Spotlight Fair – the world’s premier event for serious MBA candidates. This is your chance to hear directly from Admissions Directors at nearly every Top 30 MBA program..  Jun 12
08:30 PM IST
-09:30 PM IST
Join us for a live Coffee Chat where we discuss how applicants from competitive backgrounds can differentiate themselves and build a stronger MBA application.

Kudos
Bookmarks
Hi Everyone,
As 2015 application season is now almost over and applicants applying in 2016 have already begun the search for resources, advice for their applications, we have decided to utilize our accumulated forum data of applicants to analyze how various factors of application impact on candidate's acceptance chances.
We are going to analyze admission trends of atleast top 20 popular schools on GMATclub. For the analysis we are using last 5 years user data, i.e. from 2012 to 2016, to determine acceptance chances by GMAT score, admission rounds, industry, etc at different schools.
Since the data used for this analysis is self-reported, it's advised to use findings of this analysis with discretion. They are meant to give only a general idea of admission scenario at Bschools. Don't presume that these findings will hold true all the time. We hope these findings will provide applicants a new way to look at their applications and focus on the key areas.
Let us know your comments, opinions, suggestions or anything else that you might have to say about the findings of this analysis.
Admission Analysis:
Columbia, Fuqua, ISB, LBS, Consortium, Tuck, NUS Singapore, INSEAD, Stanford GSB, Wharton, Harvard, Oxford, Haas EWMBA, Chicago-Booth, MIT Sloan
Kudos
Bookmarks
Columbia - Admission Trends Over 5 Years!!
| Columbia Vs GMATClub: Applicant Pool YoY Comparison | ||||||||||
| 2012 Intake | 2013 Intake | 2014 Intake | 2015 Intake | 2016 Intake | ||||||
| School | GMAT Club | School | GMAT Club | School | GMAT Club | School | GMAT Club | School | GMAT Club | |
| # of Applicants | 6669 | 355 | N/A | 433 | 5765 | 577 | 5829 | 528 | N/A | 545 |
| Acceptance Rate | 0.16 | 0.23 | N/A | 0.21 | 0.18 | 0.2 | 0.18 | 0.18 | N/A | 0.17 |
| Average GMAT | 716 | 729 | N/A | 728 | 716 | 723 | 715 | 729 | N/A | 727 |
| Average GPA | 3.5 | 3.52 | N/A | 3.47 | 3.5 | 3.51 | 3.5 | 3.49 | N/A | 3.53 |
| Avg Work Experience (Months) | 56 | 61 | N/A | 60 | 57 | 56 | 60 | 58 | N/A | 58 |
| Average Age | 28 | 28 | N/A | 28 | 28 | 27 | 28 | 27 | N/A | 27 |
Acceptance Rate by GMAT Score
- Once the threshold of 720 is crossed probability of getting accepted increases to 1/3. Also you can be fairly sure of getting interview invite at that point.
Sample Size: 1238 Applicants

Acceptance Rate by Admission Round
Sample Size: 2414 Applicants

Acceptance Rates of Different Age Groups
- Greatest portion of CBS's applicant pool is coming from 25-27 age group and applicants in this group also have high admission rate.
Sample Size: 840 Applicants

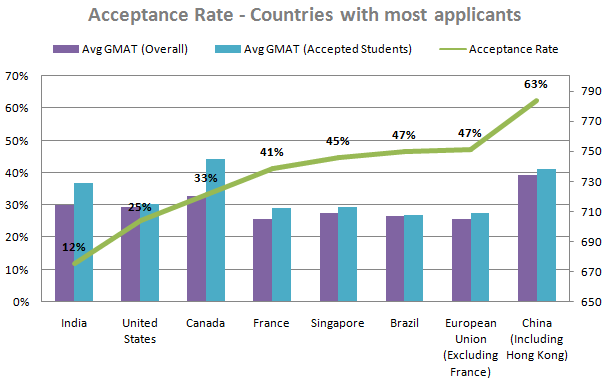
Acceptance rates by Countries
Sample Size: 821 Applicants

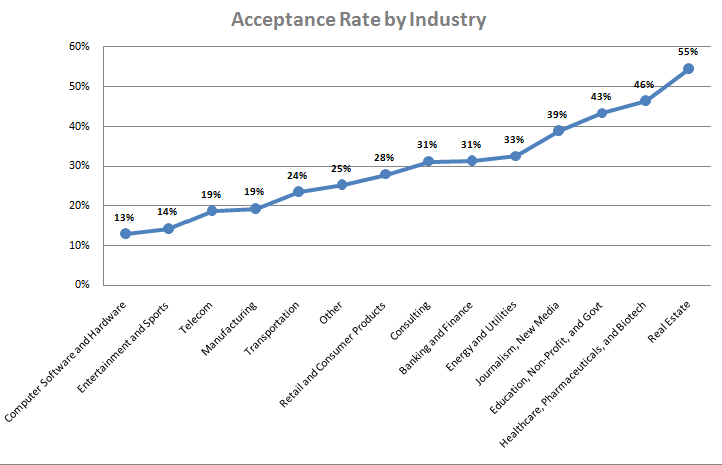
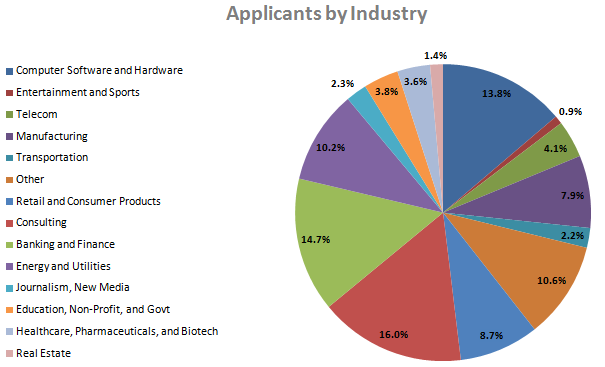
Acceptance rates of applicants from various industries
- The first chart - line chart - shows acceptance rates of applicants from various industries and the pie chart next to it shows industry-wise allocation of applicants.
Sample Size: 1003 Applicants


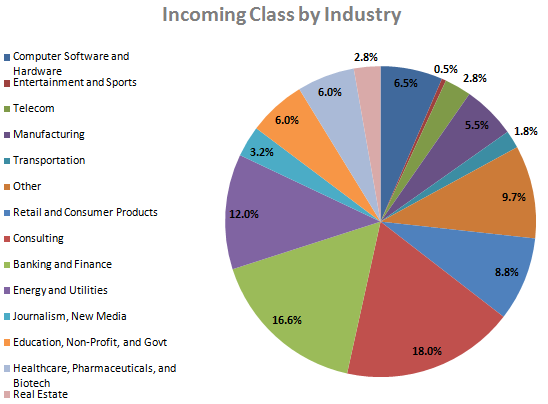
Incoming Class of CBS
- Here we have done industry-wise classification of students admitted between 2012 and 2016 to see representation of various industries in an average CBS MBA class.
Sample Size: 1003 Applicants

Kudos
Bookmarks
Fuqua - Admission Trends!
YOY Acceptance Rate and Avg GMAT of Applicants
- We can see downward trend in YOY rate of acceptance; however, I would not infer too much from the steep decline of 8 percentage points from 2012 to 2014 as our BSchool system, which introduced in 2011, was new at that time and many applicants were not familiar with it. This is evident from the increase in number of applicants from 290 in 2012 to 544 in 2014.
- Decrease in 6 percentage points from 2015 to 2016 is however a matter of concern. Fuqua's actual admission rate has also fallen from 25% to 23% during the same period.
Sample Size: 2179 Applicants

Acceptance Rate by GMAT Score
- I am quite surprised with this result. It shows that GMAT won't help much in increasing your acceptance chances beyond 700. We did not see such trend in our studies of other schools - ISB, LBS, Columbia, and Consortium.
- This indicates that a high GMAT score is not necessarily an advantage and other factors of your application i.e. Essays, work experience, recommendations, post MBA goals, resume, etc, are equally important.
Sample Size: 1184 Applicants

Acceptance Rate by Admission Round
Sample Size: 2175 Applicants

Acceptance Rates of Applicants in Different Age Groups
Sample Size: 831 Applicants

Acceptance rates of applicants from various industries
- The first chart - line chart - shows acceptance rates of applicants from various industries and the pie chart next to it shows industry-wise allocation of applicants.
Sample Size: 1015 Applicants


Acceptance Rates of Applicants from Various Regions
Sample Size: 840 Applicants