Events & Promotions
|
|

GMAT Club Daily Prep
Thank you for using the timer - this advanced tool can estimate your performance and suggest more practice questions. We have subscribed you to Daily Prep Questions via email.
Customized
for You
Track
Your Progress
Practice
Pays
Not interested in getting valuable practice questions and articles delivered to your email? No problem, unsubscribe here.
 Jun 11
11:00 AM EDT
-01:00 PM EDT
TTP GMAT OnDemand gives serious students 400+ hours of expert video instruction, the full TTP course, AI support, weekly office hours, and a 715+ score guarantee—all built for elite GMAT score improvement. Jun 10
06:00 AM PDT
-06:15 PM PDT
Register for the GMAT Club Virtual MBA Spotlight Fair – the world’s premier event for serious MBA candidates. This is your chance to hear directly from Admissions Directors at nearly every Top 30 MBA program.. Jun 22
07:30 PM EDT
-09:30 PM EDT
Master the GMAT with expert live instruction, a personalized study plan, and real-time support. Includes 40 hours of online classes plus 6 months of access to the TTP GMAT OnDemand video course. Class date: Mon/Wed June 22, 2026 →August 26, 2026

Kudos
Bookmarks

Dropdown 1: 200%
Dropdown 2: 45
Be sure to select an answer first to save it in the Error Log before revealing the correct answer (OA)!
Difficulty:
 35%
(medium)
35%
(medium)
Question Stats:
77% (02:39) correct 23%
(02:56)
wrong
based on 2139
sessions
23%
(02:56)
wrong
based on 2139
sessions
History
Date
Time
Result
Not Attempted Yet
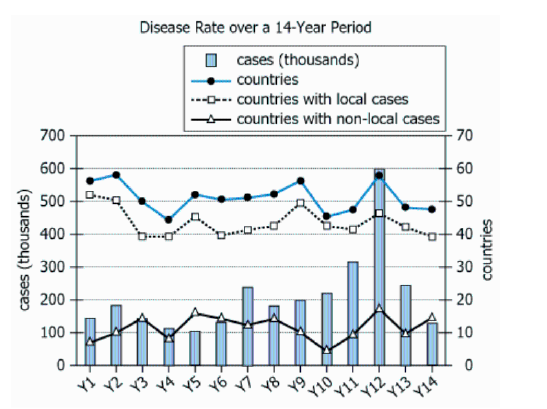
An international health organization collected global data regarding a certain disease for each of 14 consecutive years (Y1 – Y14). The graph shows the annual numbers of cases, countries, countries with local cases (i.e., cases for which the infection was contracted within the country), and countries with non-local cases (i.e., cases for which the infection was contracted outside of the country).
From each drop-down menu, select the option that creates the most accurate statement according to the information provided.
The percent increase in the number of cases of the disease from Y9 to Y12 was, to the nearest 10%, .
The average (arithmetic mean) of the numbers of countries with local cases from Y1 to Y5 was, to the nearest 5 countries, .
ShowHide Answer
Official Answer
Dropdown 1: 200%
Dropdown 2: 45
Every tricky question should trigger a follow up quiz.
Build that habit with
GMAT Club Forum Quiz →.

Kudos
Bookmarks
Part 1:
The percent increase in the number of cases of the disease from Y9 to Y12 was, to the nearest 10%, _________.
Solution:
For Y9, the number of cases if 200,000 and for Y12 the number of cases is 600,000. To calculate the percent increase in the number of cases:
Increase = 600,000 - 200,000 = 400,000.
% Increase = ( 400,000 / 200,000 ) * 100 = ( 4 / 2 ) * 100 = 200 %
Part 2:
The average (arithmetic mean) of the numbers of countries with local cases from Y1 to Y5 was, to the nearest 5 countries, _________.
Solution:
Y1 - 51 countries
Y2 - 50 countries
Y3 - 39 countries
Y4 - 40 countries
Y5 - 55 countries
Mean = ( 51 + 50 + 39 + 40 + 55 ) / 5 = 235 / 5 = 47.
Closest option choice nearest to 5 is 45.
Part 1: 200 %
Part 2: 45 countries


