Last visit was: 18 Nov 2025, 13:14 It is currently 18 Nov 2025, 13:14
Close
GMAT Club Daily Prep
Thank you for using the timer - this advanced tool can estimate your performance and suggest more practice questions. We have subscribed you to Daily Prep Questions via email.

Customized
for You

we will pick new questions that match your level based on your Timer History

Track
Your Progress

every week, we’ll send you an estimated GMAT score based on your performance

Practice
Pays

we will pick new questions that match your level based on your Timer History
Not interested in getting valuable practice questions and articles delivered to your email? No problem, unsubscribe here.
Close
Request Expert Reply
Confirm Cancel
User avatar
bb
User avatar
Founder
Joined: 04 Dec 2002
Last visit: 18 Nov 2025
Posts: 42,381
Own Kudos:
82,109
 [1]
Given Kudos: 24,103
Location: United States
GMAT 1: 750 Q49 V42
GPA: 3
Products:
Expert
Expert reply
Active GMAT Club Expert! Tag them with @ followed by their username for a faster response.
GMAT 1: 750 Q49 V42
Posts: 42,381
Kudos: 82,109
 [1]
1
Kudos
Add Kudos
Bookmarks
Bookmark this Post
User avatar
dabral
User avatar
Tutor
Joined: 19 Apr 2009
Last visit: 29 Nov 2024
Posts: 557
Own Kudos:
Given Kudos: 19
Affiliations: GMATQuantum
Expert
Expert reply
Posts: 557
Kudos: 664
Kudos
Add Kudos
Bookmarks
Bookmark this Post
avatar
achinmasli
Joined: 11 Apr 2016
Last visit: 07 Mar 2017
Posts: 2
Own Kudos:
1
 [1]
GMAT 1: 660 Q46 V35
GMAT 2: 720 Q50 V38
GMAT 2: 720 Q50 V38
Posts: 2
Kudos: 1
 [1]
1
Kudos
Add Kudos
Bookmarks
Bookmark this Post
User avatar
Nina1987
Joined: 15 Dec 2015
Last visit: 23 Oct 2023
Posts: 101
Own Kudos:
Given Kudos: 598
Posts: 101
Kudos: 74
Kudos
Add Kudos
Bookmarks
Bookmark this Post
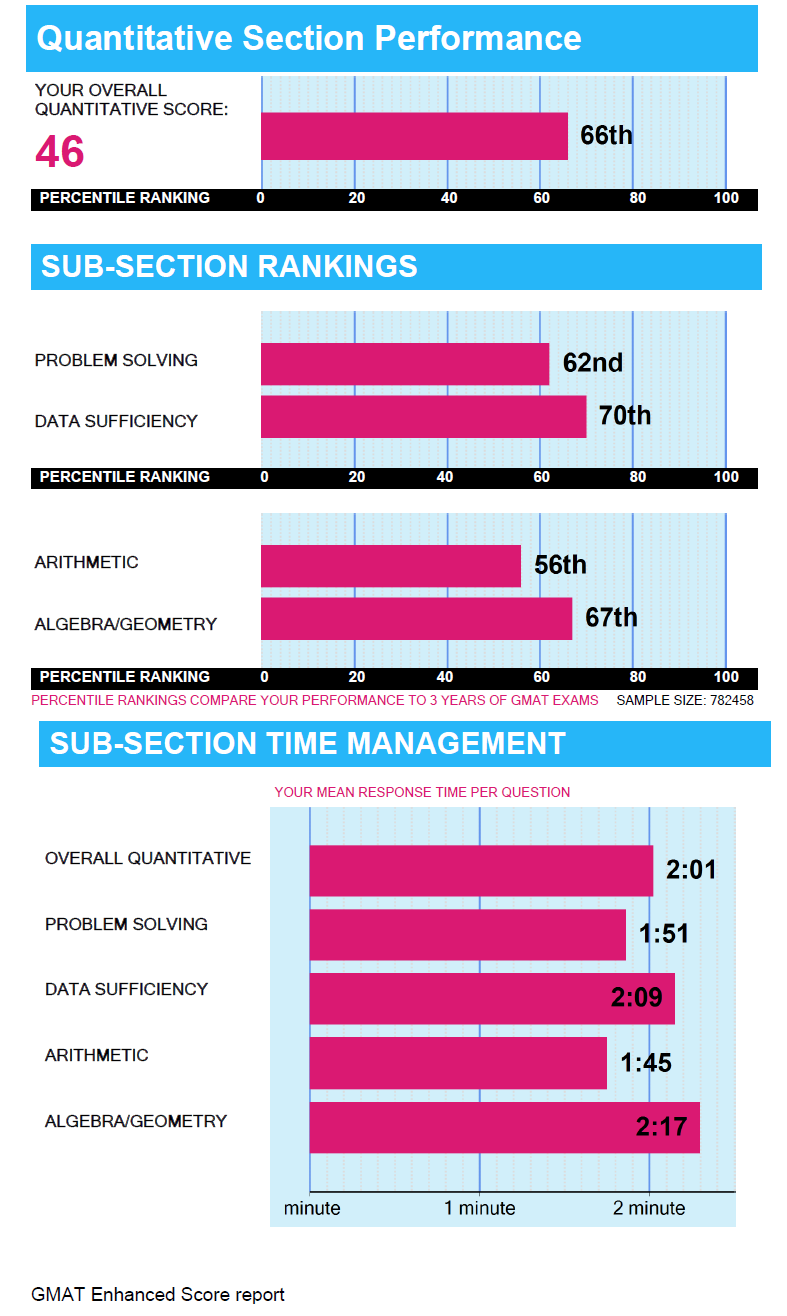
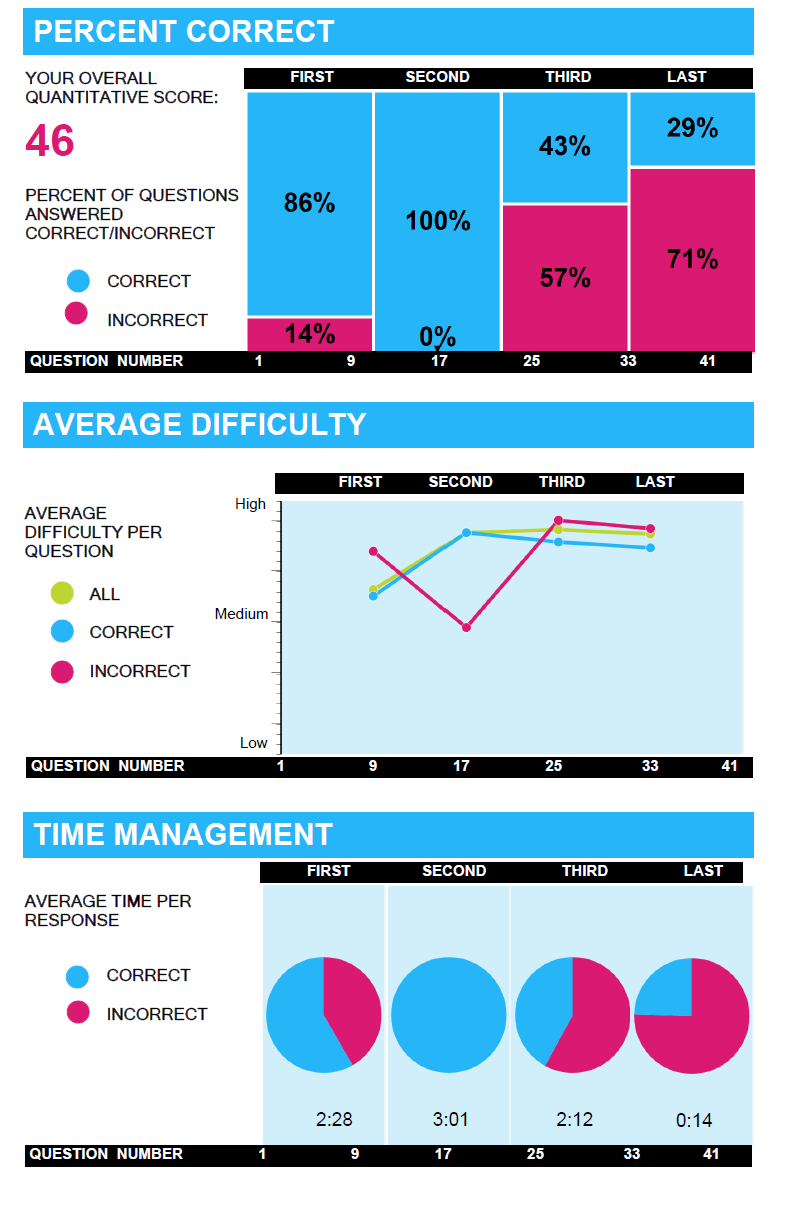
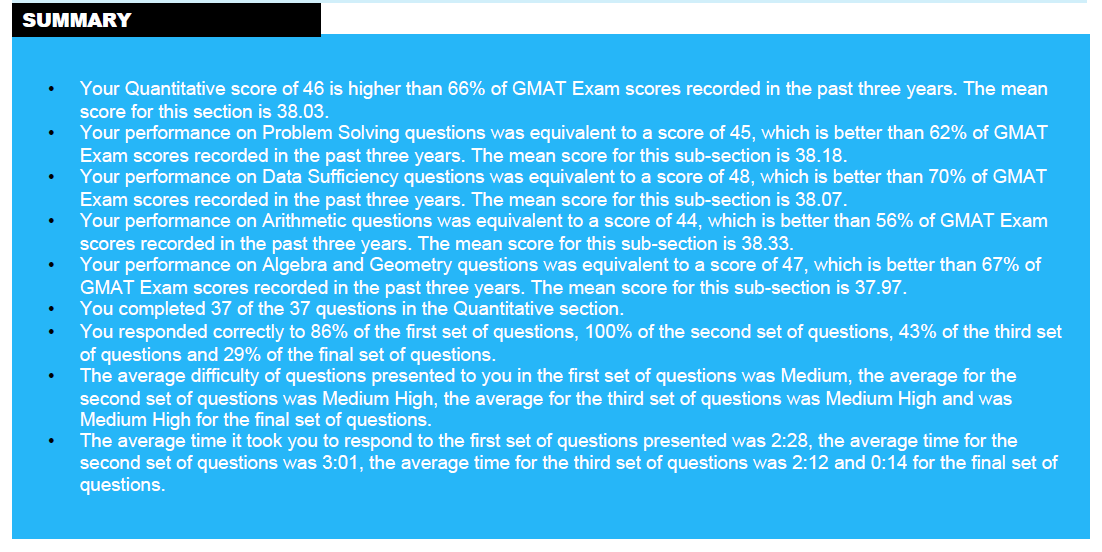
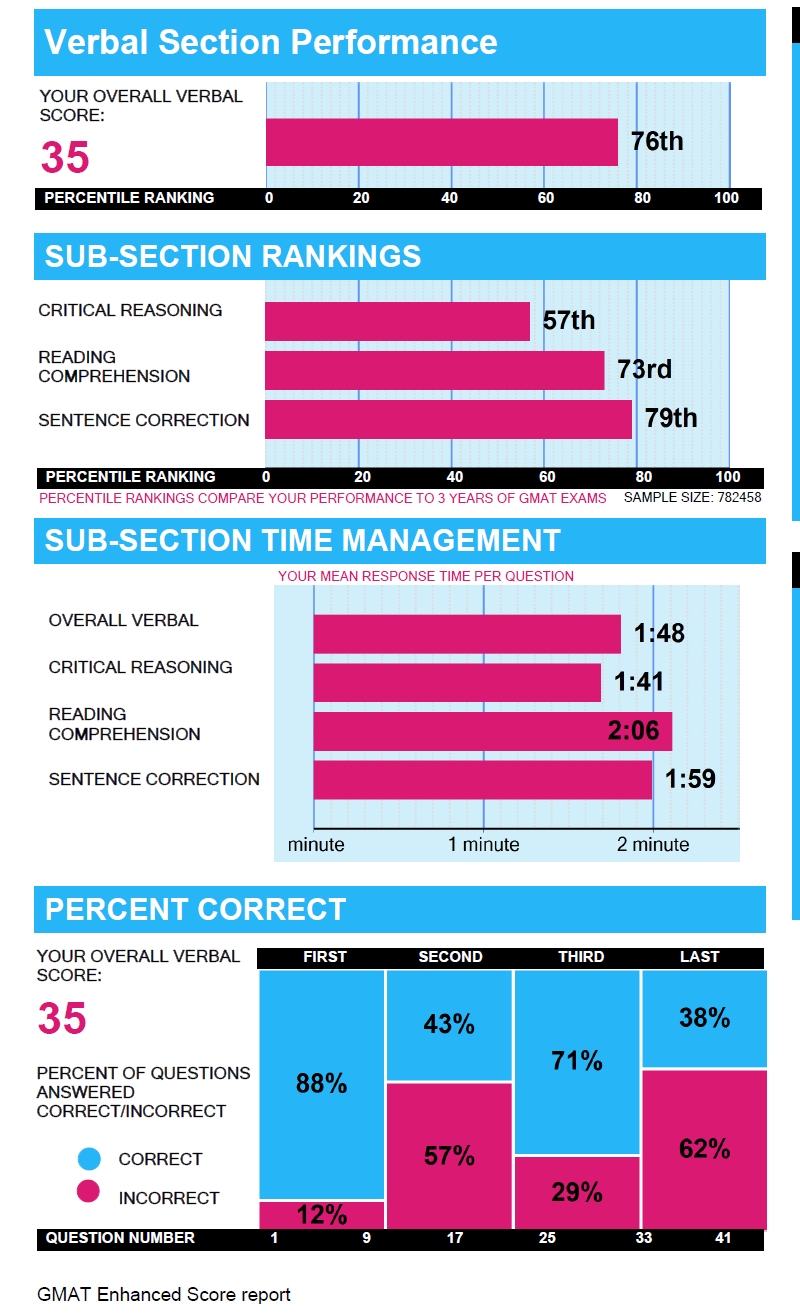
I don't understand these pie charts in Time Management section. Can someone throw some light now it? Thank you!
User avatar
mvictor
User avatar
Board of Directors
Joined: 17 Jul 2014
Last visit: 14 Jul 2021
Posts: 2,124
Own Kudos:
Given Kudos: 236
Location: United States (IL)
Concentration: Finance, Economics
GMAT 1: 650 Q49 V30
GPA: 3.92
WE:General Management (Transportation)
Products:
GMAT 1: 650 Q49 V30
Posts: 2,124
Kudos: 1,263
Kudos
Add Kudos
Bookmarks
Bookmark this Post
Nina1987
I don't understand these pie charts in Time Management section. Can someone throw some light now it? Thank you!

they show how much you spend, on average, on correctly answered questions and on incorrectly answered questions.
Since each section is divided into 4 parts, then the average timing is as well separated for each part.
User avatar
Nina1987
Joined: 15 Dec 2015
Last visit: 23 Oct 2023
Posts: 101
Own Kudos:
Given Kudos: 598
Posts: 101
Kudos: 74
Kudos
Add Kudos
Bookmarks
Bookmark this Post
mvictor
Nina1987
I don't understand these pie charts in Time Management section. Can someone throw some light now it? Thank you!

they show how much you spend, on average, on correctly answered questions and on incorrectly answered questions.
Since each section is divided into 4 parts, then the average timing is as well separated for each part.

Are you sure it means that? Look at achinmasli's report- if what you say is true that mean he/she spent 33% of time in first part for only 1 incorrect question. Do you see what I mean?
User avatar
Nina1987
Joined: 15 Dec 2015
Last visit: 23 Oct 2023
Posts: 101
Own Kudos:
Given Kudos: 598
Posts: 101
Kudos: 74
Kudos
Add Kudos
Bookmarks
Bookmark this Post
Also the new ESR is scary. With so much information out there, I don't know where it is gonna leads us. Will GSB/HBS soon report their averages in 780s???
User avatar
mvictor
User avatar
Board of Directors
Joined: 17 Jul 2014
Last visit: 14 Jul 2021
Posts: 2,124
Own Kudos:
Given Kudos: 236
Location: United States (IL)
Concentration: Finance, Economics
GMAT 1: 650 Q49 V30
GPA: 3.92
WE:General Management (Transportation)
Products:
GMAT 1: 650 Q49 V30
Posts: 2,124
Kudos: 1,263
Kudos
Add Kudos
Bookmarks
Bookmark this Post
Nina1987
mvictor
Nina1987
I don't understand these pie charts in Time Management section. Can someone throw some light now it? Thank you!

they show how much you spend, on average, on correctly answered questions and on incorrectly answered questions.
Since each section is divided into 4 parts, then the average timing is as well separated for each part.

Are you sure it means that? Look at achinmasli's report- if what you say is true that mean he/she spent 33% of time in first part for only 1 incorrect question. Do you see what I mean?

i don't think you understand correctly what I was saying.
the pie - average of time for all questions (ex. 12 minutes for 9 questions => 12min/9).
blue - average of time for all correct questions
red - average of time for all incorrect questions.
User avatar
bb
User avatar
Founder
Joined: 04 Dec 2002
Last visit: 18 Nov 2025
Posts: 42,381
Own Kudos:
82,109
 [1]
Given Kudos: 24,103
Location: United States
GMAT 1: 750 Q49 V42
GPA: 3
Products:
Expert
Expert reply
Active GMAT Club Expert! Tag them with @ followed by their username for a faster response.
GMAT 1: 750 Q49 V42
Posts: 42,381
Kudos: 82,109
 [1]
1
Kudos
Add Kudos
Bookmarks
Bookmark this Post
Just to pitch in, personally I also do not like the pie chart representation of average times. I get the concept but it throws me off visually. For myself, a bar or any of other chart would've been better. Maybe it is me.


Sent from my iPhone using GMAT Club Forum App
User avatar
HKD1710
User avatar
Retired Moderator
Joined: 22 Jun 2014
Last visit: 26 Feb 2021
Posts: 961
Own Kudos:
4,517
 [1]
Given Kudos: 182
Location: India
Concentration: General Management, Technology
GMAT 1: 540 Q45 V20
GPA: 2.49
WE:Information Technology (Computer Software)
GMAT 1: 540 Q45 V20
Posts: 961
Kudos: 4,517
 [1]
1
Kudos
Add Kudos
Bookmarks
Bookmark this Post
All we get as the help from the provided pie chart for time management is that you get to know the average time for wrong answers and average time for a right answer (you only see this when you move the cursor over the red and blue part). As you know the number of wrong questions and right questions percentages from other charts, you can evaluate your timing on an average.
User avatar
Nina1987
Joined: 15 Dec 2015
Last visit: 23 Oct 2023
Posts: 101
Own Kudos:
Given Kudos: 598
Posts: 101
Kudos: 74
Kudos
Add Kudos
Bookmarks
Bookmark this Post
mvictor


i don't think you understand correctly what I was saying.
the pie - average of time for all questions (ex. 12 minutes for 9 questions => 12min/9).
blue - average of time for all correct questions
red - average of time for all incorrect questions.

Im afraid I still dont get. :(

Continuing your ex. the person would have spent 1min 20sec on an average. Now if the pie chart shows 50-50% red and blue, do you mean she/he spent 40 secs on avg on correct and incorrect questions?
User avatar
HKD1710
User avatar
Retired Moderator
Joined: 22 Jun 2014
Last visit: 26 Feb 2021
Posts: 961
Own Kudos:
4,517
 [2]
Given Kudos: 182
Location: India
Concentration: General Management, Technology
GMAT 1: 540 Q45 V20
GPA: 2.49
WE:Information Technology (Computer Software)
GMAT 1: 540 Q45 V20
Posts: 961
Kudos: 4,517
 [2]
2
Kudos
Add Kudos
Bookmarks
Bookmark this Post
Nina1987
mvictor


i don't think you understand correctly what I was saying.
the pie - average of time for all questions (ex. 12 minutes for 9 questions => 12min/9).
blue - average of time for all correct questions
red - average of time for all incorrect questions.

Im afraid I still dont get. :(

Continuing your ex. the person would have spent 1min 20sec on an average. Now if the pie chart shows 50-50% red and blue, do you mean she/he spent 40 secs on avg on correct and incorrect questions?

You do not have to assume this. when you move the cursor over the red and blue part you see the individual average time. this will happen only when you open the ESR with the provided link. the same will not happen after to save the report as a pdf.
User avatar
bb
User avatar
Founder
Joined: 04 Dec 2002
Last visit: 18 Nov 2025
Posts: 42,381
Own Kudos:
Given Kudos: 24,103
Location: United States
GMAT 1: 750 Q49 V42
GPA: 3
Products:
Expert
Expert reply
Active GMAT Club Expert! Tag them with @ followed by their username for a faster response.
GMAT 1: 750 Q49 V42
Posts: 42,381
Kudos: 82,109
Kudos
Add Kudos
Bookmarks
Bookmark this Post
HKD1710
All we get as the help from the provided pie chart for time management is that you get to know the average time for wrong answers and average time for a right answer (you only see this when you move the cursor over the red and blue part). As you know the number of wrong questions and right questions percentages from other charts, you can evaluate your timing on an average.

By looking, what I would have assumed is that the blue section is the portion of all time within that quarter that one has spent on the correct answered questions and the red segment is the portion of all time within that quarter one spent on incorrect questions. The average, however throws me off and looks like it is doing the same to a few other folks. (Tell me if I am wrong in my evaluation anywhere here). Thank you for your help!
User avatar
Nina1987
Joined: 15 Dec 2015
Last visit: 23 Oct 2023
Posts: 101
Own Kudos:
Given Kudos: 598
Posts: 101
Kudos: 74
Kudos
Add Kudos
Bookmarks
Bookmark this Post
HKD1710
Nina1987
mvictor


i don't think you understand correctly what I was saying.
the pie - average of time for all questions (ex. 12 minutes for 9 questions => 12min/9).
blue - average of time for all correct questions
red - average of time for all incorrect questions.

Im afraid I still dont get. :(

Continuing your ex. the person would have spent 1min 20sec on an average. Now if the pie chart shows 50-50% red and blue, do you mean she/he spent 40 secs on avg on correct and incorrect questions?

You do not have to assume this. when you move the cursor over the red and blue part you see the individual average time. this will happen only when you open the ESR with the provided link. the same will not happen after to save the report as a pdf.

So just to be clear- are u saying if one's average times for correct and incorrect questions are 1min and 2mins respectively, the blue portion would be 33%(1/3) and the red 66%(2/3)? Thank you
User avatar
HKD1710
User avatar
Retired Moderator
Joined: 22 Jun 2014
Last visit: 26 Feb 2021
Posts: 961
Own Kudos:
4,517
 [1]
Given Kudos: 182
Location: India
Concentration: General Management, Technology
GMAT 1: 540 Q45 V20
GPA: 2.49
WE:Information Technology (Computer Software)
GMAT 1: 540 Q45 V20
Posts: 961
Kudos: 4,517
 [1]
1
Kudos
Add Kudos
Bookmarks
Bookmark this Post
bb
HKD1710
All we get as the help from the provided pie chart for time management is that you get to know the average time for wrong answers and average time for a right answer (you only see this when you move the cursor over the red and blue part). As you know the number of wrong questions and right questions percentages from other charts, you can evaluate your timing on an average.

By looking, what I would have assumed is that the blue section is the portion of all time within that quarter that one has spent on the correct answered questions and the red segment is the portion of all time within that quarter one spent on incorrect questions. The average, however throws me off and looks like it is doing the same to a few other folks. (Tell me if I am wrong in my evaluation anywhere here). Thank you for your help!

You have evaluated it correctly BB. it is confusing and looks not useful because following is not explicitly mentioned:
Blue - Average time for the correct answers. (move the cursor on the blue portion to know it)
Red - Average time for the wrong answers. (move the cursor on the red portion to know it)

No more confusion now :)
User avatar
HKD1710
User avatar
Retired Moderator
Joined: 22 Jun 2014
Last visit: 26 Feb 2021
Posts: 961
Own Kudos:
4,517
 [1]
Given Kudos: 182
Location: India
Concentration: General Management, Technology
GMAT 1: 540 Q45 V20
GPA: 2.49
WE:Information Technology (Computer Software)
GMAT 1: 540 Q45 V20
Posts: 961
Kudos: 4,517
 [1]
1
Kudos
Add Kudos
Bookmarks
Bookmark this Post
Nina1987

So just to be clear- are u saying if one's average times for correct and incorrect questions are 1min and 2mins respectively, the blue portion would be 33%(1/3) and the red 66%(2/3)? Thank you

Yes. the pie charts presented in ESR are solely depend on time taken by correct questions and incorrect questions. To clarify the same point i have attached this snapshot with explanation. Hope it would help.
Attachments

Time management analysis.png
Time management analysis.png [ 89.97 KiB | Viewed 4219 times ]

User avatar
HanoiGMATtutor
Joined: 24 Jun 2016
Last visit: 25 Sep 2019
Posts: 333
Own Kudos:
Given Kudos: 21
GMAT 1: 770 Q60 V60
GPA: 4
GMAT 1: 770 Q60 V60
Posts: 333
Kudos: 142
Kudos
Add Kudos
Bookmarks
Bookmark this Post
bb
Just to pitch in, personally I also do not like the pie chart representation of average times. I get the concept but it throws me off visually. For myself, a bar or any of other chart would've been better. Maybe it is me.


Sent from my iPhone using GMAT Club Forum App

That visual representation is pretty intuitive to me ... To each his own, I guess.

It does help that you are able to hover your cursor over the pie charts to understand more clearly what they're saying.
User avatar
Nina1987
Joined: 15 Dec 2015
Last visit: 23 Oct 2023
Posts: 101
Own Kudos:
Given Kudos: 598
Posts: 101
Kudos: 74
Kudos
Add Kudos
Bookmarks
Bookmark this Post
Thanks for making it clear. Wow do you also get to see how much time you spent on each question and its outcome 'correct/incorrect'?

HKD1710
Nina1987

So just to be clear- are u saying if one's average times for correct and incorrect questions are 1min and 2mins respectively, the blue portion would be 33%(1/3) and the red 66%(2/3)? Thank you

Yes. the pie charts presented in ESR are solely depend on time taken by correct questions and incorrect questions. To clarify the same point i have attached this snapshot with explanation. Hope it would help.

Attachments

Capture.PNG
Capture.PNG [ 29.93 KiB | Viewed 3940 times ]

User avatar
HKD1710
User avatar
Retired Moderator
Joined: 22 Jun 2014
Last visit: 26 Feb 2021
Posts: 961
Own Kudos:
Given Kudos: 182
Location: India
Concentration: General Management, Technology
GMAT 1: 540 Q45 V20
GPA: 2.49
WE:Information Technology (Computer Software)
GMAT 1: 540 Q45 V20
Posts: 961
Kudos: 4,517
Kudos
Add Kudos
Bookmarks
Bookmark this Post
Nina1987
Thanks for making it clear. Wow do you also get to see how much time you spent on each question and its outcome 'correct/incorrect'?

HKD1710
Nina1987

So just to be clear- are u saying if one's average times for correct and incorrect questions are 1min and 2mins respectively, the blue portion would be 33%(1/3) and the red 66%(2/3)? Thank you

Yes. the pie charts presented in ESR are solely depend on time taken by correct questions and incorrect questions. To clarify the same point i have attached this snapshot with explanation. Hope it would help.

No! We don't get to see the time spent on each question. snapshot of data in excel sheet is prepared by me to answer your query.
avatar
himpuju
Joined: 11 Jul 2015
Last visit: 19 Dec 2023
Posts: 63
Own Kudos:
257
 [1]
Given Kudos: 5
Status:Current Student
Location: Belgium
Concentration: General Management, Technology
GMAT 1: 760 Q50 V41
GPA: 3.6
WE:Project Management (Computer Software)
1
Kudos
Add Kudos
Bookmarks
Bookmark this Post
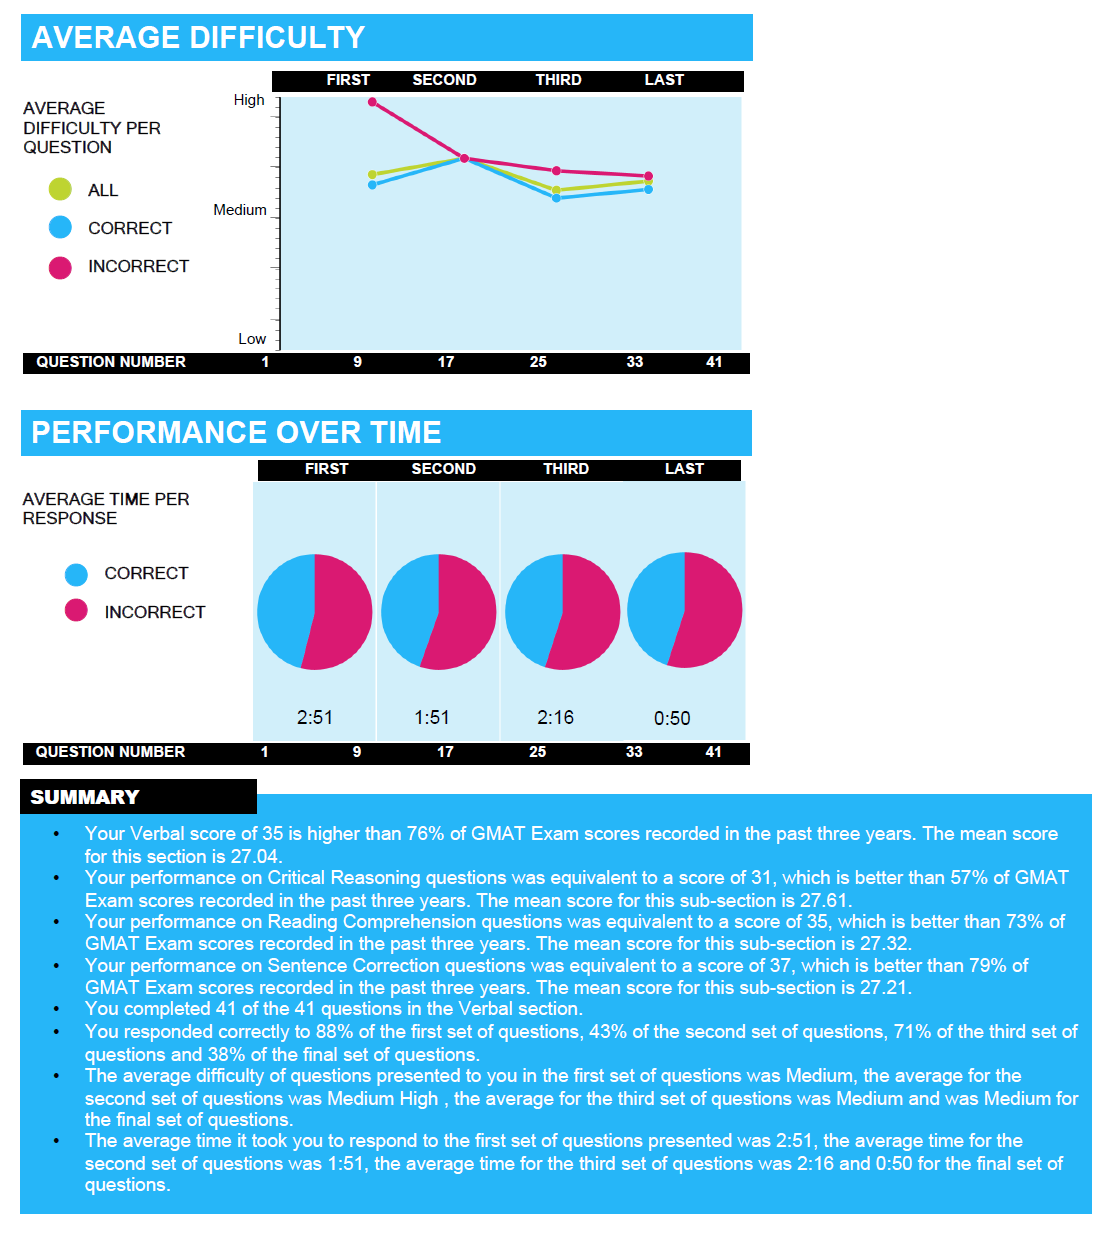
Thanks HiLine for informing me about this.

My score - 760 Q50 V41. Break up below.
Attachments

File comment: Verbal 2
Himpuju_verbal_2.jpg
Himpuju_verbal_2.jpg [ 155.46 KiB | Viewed 3983 times ]

File comment: Verbal 1
Himpuju_verbal_1.jpg
Himpuju_verbal_1.jpg [ 158.07 KiB | Viewed 3971 times ]

File comment: Quants
Himpuju_quants.jpg
Himpuju_quants.jpg [ 138.03 KiB | Viewed 3984 times ]

   1   2   3   4   5   6   7   8   
Moderator:
General GMAT Forum Moderator
444 posts