
 Sign in with Google
 Sign in with Apple
If you’re in the midst of GMAT preparation or the MBA application process, you’ve almost certainly stumbled upon (or actively researched) stories about rising GMAT scores.
It wasn’t too long ago that an overall score of 700 represented a nice, round, respected target, even for top schools. In 2005, the cream of the MBA crop was littered with 700-level average GMAT scores – 707 at HBS, 704 at Tuck, 701 at Haas, 700 at Kellogg and Sloan, and 695 at Booth – all of which are bound to evoke jealousy or disbelief among applicants entering the process today.
Back in 1996, incoming classes at many of those MBA programs had average GMAT scores in the 650 to 660 range. At the start of the 21st century, a Quant sub-score of 45 put you in the 82nd percentile. A few years later, it was good for 78th (2006), then 75th (2007), then 71st (2009), and 66th (2013). Today, that Q45 lands you in the 57th percentile of GMAT test takers worldwide!
There is no denying the GMAT arms race – and applicants, schools, and rankings are all in on the action. More people are taking the test, test takers can freely cancel unwanted scores, applicants worried about the GMAT can now take the GRE, and MBA programs are as rankings-focused as ever before. The causes are myriad, and the impact on MBA classes continues to play out.
Discussions about cause and effect are nice, but we’ll save those for another day. My goal here is to take a closer look at the rise of GMAT scores by schools and "tiers" – with the hope of helping you better visualize what the GMAT field looks like among the top full-time MBA programs in the U.S.
Average GMAT Scores (Means)
As you’ve Googled around and gone down a few GMAT Club rabbit holes, you may have encountered claims that “720 is the new 700.” While I usually caution against sweeping generalizations, MBA adages, or blog paranoia, the 720-is-the-new-700 concept does hold water.
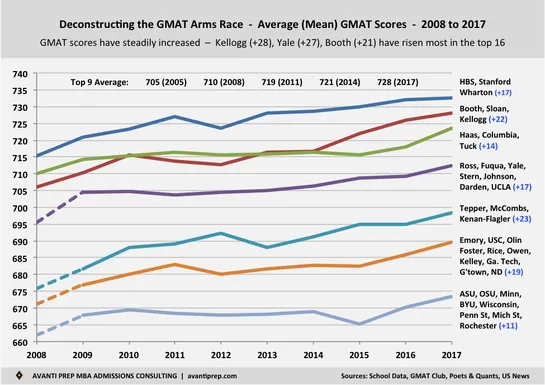
- From 2005 to 2017, the average GMAT score at HBS, Stanford, and Wharton increased from 711 to 733. So a 700 in 2005 and a 720 in 2017 both put you about a dozen points off the H/S/W pace.
- From 2005 to 2017, the average GMAT score at Booth, MIT Sloan, Kellogg, Berkeley-Haas, Columbia, and Tuck increased from 702 to 726. So in that sense, the 700 in 2005 and the 720 in 2017 both landed you right around (or a few points behind) par for those programs.
- From 2008 to 2017, the average GMAT score at Ross, Fuqua, Yale, Stern, Johnson, Darden, and Anderson increased from 696 to 713. Again, last decade's 700 pretty much accomplished what a 720 does today, placing you a few points above the mean at this collection of #10 to #16 schools.
- The next two tiers also saw 20ish-point upticks in average GMAT scores over the past decade. Certain programs notwithstanding, you really have to look out to the 30s and 40s in the rankings before you start to see average GMAT scores trending up by 10 points instead of 20.
- The biggest gains since 2008 among the top 16 programs belong to Kellogg (704 to 732, +28 points), Yale (700 to 727, +27), and Booth (709 to 730, +21). In the next group, Kenan-Flagler (677 to 701, +24) and McCombs (681 to 703, +22) have climbed significantly since 2009.
- Other notables outside of the top 20 include Rice (668 to 711, +43 points since 2009), Vanderbilt (653 to 690, +37 points), and Michigan State (640 to 674, +34 points). Rice's average GMAT jumped 21 points in the last year alone, so we'll have to see if that was merely a one-year blip.
- If you're interested in more school-specific information, Poets and Quants runs an excellent annual GMAT series. Each analysis includes five-year look-backs for the top 50 U.S. programs.
Median GMAT Scores
Most top-tier programs report mean GMAT scores on their class profile pages. But every so often, you will come across a school that only provides the median. Examples include HBS, Yale, and UNC Kenan-Flagler. Thankfully, if you do a little digging, you can find those means reported elsewhere.
The reverse exercise is the far more cumbersome task. That is to say, if you really want to know the median GMAT scores across programs, only a handful of schools give it to you directly. So you have to sleuth around. Poets and Quants' "Meet XYZ's Class of 2019" tends to cite both where available.>
When doing your school diligence, I encourage you to compare means to means and medians to medians. As you'll see in the data that follows, the median GMAT score at a given MBA program is usually higher than the mean. (You can typically round the mean up to the nearest 10 points.)
Over the past decade, estimated median GMAT scores at the top 19 U.S. MBA programs have trended upward by a solid 20 points. There's a 10-point median uptick for schools ranked in the 20s and 30s. (Note that certain 2017 medians and some historical data reflect mean-based estimates.)
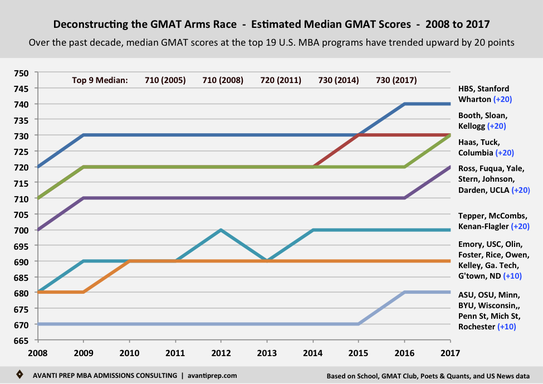
- As a group, Harvard, Stanford, Wharton increased from 720 to 740.
- Booth, Sloan, Kellogg, Haas, Columbia, Tuck increased from 710 to 730.
- Ross, Fuqua, Yale, Stern, Johnson, Darden, and Anderson increased from 700 to 720.
- Tepper, McCombs, and Kenan-Flagler increased from 680 to 700.
- Scroll down for up-to-date GMAT data for the top 19 U.S. MBA programs.
There's more to it than the GMAT
The GMAT is, of course, only one piece of the application puzzle. Nearly every admissions officer will tell you that evaluations are “holistic,” and that’s true. When considering an applicant’s profile, GMAT scores shouldn't be viewed in a vacuum. Nor should anything else. Your whole story matters.
But GMAT scores are still a helpful reference point when trying to determine how you line up. To that end, I’ve included GMAT and GPA data for the top 19 U.S. programs below. Remember to consider not only the average GMAT scores at a given program, but also the “middle 80% range.”
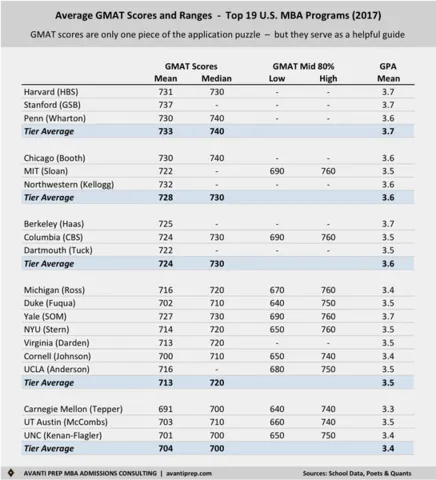
On top of that, consider the dynamics of your own situation. If you’re from an overrepresented pool of applicants or have certain weaknesses in your application, applying from the lower end of the middle 80% range will make things quite difficult. Be positive – but also be honest.
If you’d like to chat about your profile or story, please feel free to sign up for a Free Consultation. [And for a fantastic analysis of the MBA admissions chances for Indian applicants at the top 50 U.S. programs – including GMAT score data – please check out this GMAT Club post.]
This post originally appeared on AvantiPrep.com